
Excel University Blog
Read on for in-depth articles, tutorials, and videos. Search or browse for specific topics. Be sure to subscribe if you'd like to be notified when we write something new.
PivotTable
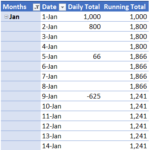
When you download banking activity, you typically get the transactions, but not the daily bank balance. To compute the daily bank balance, you need to summarize the transactions by day and display a running total for all days, even those without any activity. This post demonstrates how to build such a report using a PivotTable. Overview…
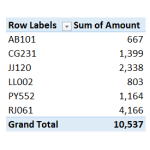
PivotTable users frequently spend time assigning the same number format to PivotTable values. To my knowledge, there isn’t a built-in setting that allows us to define a default value field format. But, it is pretty easy to set up a macro that instantly assigns a desired format. This post walks through the steps of creating such a macro. Objective…
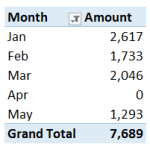
If you have ever created a PivotTable report that groups by month, you may have encountered an awkward situation where the PivotTable only displays the months that actually have data in the source. The PivotTable will summarize the data that exists and if there are no transactions for a given month, the PivotTable won’t display it.…

Did you know that PivotTables can automatically group date fields by month? And by quarter and year? This date group capability makes it easy to summarize data in monthly columns without writing a single formula. Check out my recent California CPA Magazine article for the details. Publication: California CPA Magazine Author: Jeff Lenning CPA Date: May 2015…
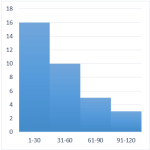
A histogram graphically displays the number of items that fall within equal intervals, or, bins. For example, the number of days with a high temperature between 71-80 degrees, 81-90, and 91-100, the number of students with test scores between 60-69, 70-79, 80-89, or the number of invoices that are due in 31-60, 61-90, or 91-120…

In this post, we’ll check out a few PivotTable formatting techniques that help get our report looking just right. Objective Our objective is to create the following PivotTable report. There are a few formatting points to note about the report. First, the region groups, such as Midwest and Northeast, are in the same column as the…

In this post, we’ll recreate a heat map presented in Stephen Few’s Information Dashboard Design, 2nd Edition, using an Excel PivotTable and a bit of conditional formatting. Objective Before we get too far, let’s take a look at our objective. We are trying to create a heat map that uses variation in color intensity to…

In this post, we’ll create two data validation drop-down cells that provide the ability to select From and To dates based on the transaction dates stored in the source data. This will ensure that the date selections fall within a valid range of dates, that is, those months with data in the table. This technique…

In this post, we’ll explore a method for generating a drop-down that contains a unique list of choices derived from a table column with duplicate values. Objective Before we get started on the mechanics, let’s take a look at what we are trying to achieve. We have a data table that is exported from our…

In this post, we’ll explore three methods for transposing data in Excel. The first method can be used when you just want to quickly to transpose the values manually. The second method can be used when you want formulas to perform the transposition automatically based on the labels. The third method can be applied when…