PivotTable Percentage of Parent Total
This post demonstrates how to set up a PivotTable to show 100% on the subtotal lines when using the show values as a percentage of parent total option.
Overview
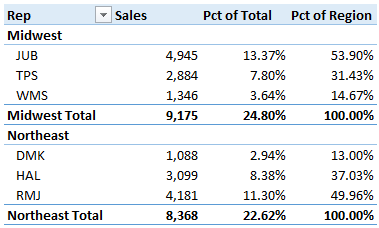
Before we begin, let’s review our objective. We want to summarize our data by region, and within each region, by rep. We also want to show each rep’s sales as a percentage of the company total and as a percentage of their region’s total. When we are done, we want the report to look a little something like this:
Sound good? Alright, let’s do this thing.
How To
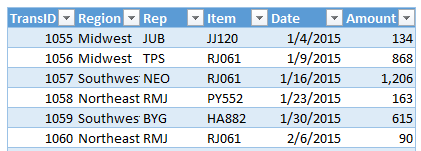
Let’s take a moment and look at the data source for the PivotTable:
To create the PivotTable report, we begin by setting up the row and value fields. We use region and rep as the row fields, and amount as the value field. Here is what we have so far:

Now, let’s tackle the percent of total column. We insert the amount field into the values area again, by dragging-and-dropping it, and then open the Value Field Settings dialog. From the Show Values As tab, we select % of Grand Total. These steps are illustrated in the animated image below:
Next, let’s tackle the percent of region column. This option is available beginning with Excel 2010. We need to insert the amount field again, by dragging-and-dropping, and then open the Value Field Settings dialog. On the Show Values As tab, we select % of Parent Total, and then define the base field as Region. These steps are illustrated below:

By setting the base field as region, we tell the PivotTable the denominator. The numerator of course is the sales total, and the denominator is the region total.
If, instead of choosing Percent of Parent Total, we chose Percent of Parent Row Total, the report would properly display the individual rep percentages, because the parent of a rep is its region. The region subtotal rows would show the percentage of their parent total, which is the report total. This option would not show 100% in the region rows as desired. By using the Percent of Parent Total option instead, we are able to identify a specific base field, which is applied to all column values. This shows 100% for the region subtotals as desired.
Conclusion
Thanks to Microsoft for continuing to develop one of the best Excel features…PivotTables!
If you have any other approaches or tips, please post a comment below….thanks!
Resources
- Download the file: ParentPercent
Excel is not what it used to be.
You need the Excel Proficiency Roadmap now. Includes 6 steps for a successful journey, 3 things to avoid, and weekly Excel tips.
Want to learn Excel?
Our training programs start at $29 and will help you learn Excel quickly.
Hi, I’m using MS Excel 2013, and the Show Values as “Percent of Parent Row Total” option doesn’t exist. Did Excel remove this option? I even downloaded your file “ParentPercent” and it appears that after I undo that % of parent subtotal, I lose the option to add it again.
Thank you,
Scott
Scott,
To my knowledge, Microsoft hasn’t removed that option…and to be sure, I just created a new PT and confirm that the Percent of Parent Row Total is still there. I’m wondering if it may have something to do with which version of Excel you may be using? For example, the home or personal version?
Let me know?
Thanks
Jeff
When you have something like “% of Parent Total” and the see the value in the grid, what if you wanted to say, “I only want to see the rows that are more 30%”?
It seems like you when you have a sum and then show it as “% of parent row total”, you can’t filter on that aggregated value.
If you click just to the right of the top row and click
home>sort & filter>filter
it will add filters to each column in the table.
This is a work-around and isn’t technically a Pivot Table feature.
Thank you very much Jeff, i have been trying to do this in SSAS Cube and it is very simple in Excel.
Welcome 🙂
Why not just use the % of Parent Column calculation in the dropdown?
Bender,
Thanks for your comment…often the right-click drop-downs are a fast alternative to opening the Field Settings dialog. Although the % of Parent Column option won’t provide the desired result in this case, the Percent of Parent Total option would…thanks!
Thanks,
Jeff
Is there a way to use the “show as a percentage of total” column in a subsequent calculation, i.e. calculated field? I need to use percentage of total sales in order to distribute a fixed amount of rebates. I can manually add in this formula but it would be great if there’s a way to use the % total column as a calculated field so I don’t have to update every time the pivot table data changes.
Rick,
I think what you need is the GETPIVOTDATA() formula and you can create your % column with a formula that automatically updates.
Thanks,
Kurt
Rick,
I think you are looking for the GETPIVOTDATA() formula to make your own % column.
Thanks,
Kurt
Hi, when I press % of Grand Total I get 100% even though I do have several values …why is that?
Thanks,
Simon
Hey Simon
Can you send me your spreadsheet to help you better? I’m having trouble picturing the problem…My email is [email protected]
Thanks,
Kurt LeBlanc
Hi. I have Excel 2010. I see how to show values as % of Parent Row Total, but I’m not allowed to choose a base field. (the base field choices are in gray font and I’m unable to make a selection). I’d appreciate any guidance you can offer.
thanks!
I answered my own question. I had selected the wrong choice and after selecting % of Parent total per the instructions I’m in business. Thanks much!
Glad you got it! 🙂
Thanks
Jeff
Where is “% of Parent Total” in Excel for Mac 2011?
thanks
I’m so sorry, but I don’t have a copy of Excel 2011 for Mac, so I’m unable to confirm this option is available and if so where it may be. Hopefully another reader may be able to post a comment to help us out.
Thanks
Jeff
I am using Excel for Mac (Office 2016 version), and “% of Parent Total” is not present. It is, however, present in my copy of Excel 2010 for Windows. “% of Parent Total” may be one of the PowerPivot features that is supported on Windows but not Mac.
I’m really sorry Dan, but I don’t have Excel for Mac…Hopefully another reader has it and can help.
Sorry to disappoint
Thanks for the post. How would I subtract one of those columns from the other?
I’m trying to calculate the difference between % Parent Row Total for two different columns (time periods).
Hey Adam,
To analyze the results of a Pivot Table, you can use the GETPIVOTDATA() formula. It’s a bit tricky to learn what the right arguments you need are, but once you do, it’s really useful! Let me know if you need more help with it.
Thanks,
Kurt LeBlanc
Thank you for this information. I have been trying to figure out how to get the percentage in the Region, based on your dataset. Is there a way to have the Rep % to show the total for each Region, then instead of the Region Total show 100% have it show the % of the Grand Total?
Midwest
JUB 53.90%
TPS 31.43%
WMS 14.67%
Midwest Total 24.8 %
Without having a separate column?
Hey Jeff
Yes you can:) It is another option in “Show Values As” called “% of Parent ROW Total”. It’ll take the percentage of the different categories of the whole category, then display each category as a percent of the whole table. It’s pretty amazing how much a Pivot Table can do and how simple it is!
Let me know how that works out for you,
Kurt LeBlanc
“% of Parent Row Total” converted all to 100%.
I am tracking labor hours with 4 different departments with various job codes in each department. Here is what I need to see:
Dept BOH BOH Total Company Total
Dishwasher Expo Cook
Hrs Hr% Hrs Hr% Hrs Hr% Hrs Hr%
Store 1092 44.51 10.63% 34.58 8.26% 339.76 81.12% 418.85 33.41% 1,253.49 100%
1573 143.51 27.06% 7.52 1.42% 379.29 71.52% 530.32 37.02% 1,432.42 100%
If I use “% of Parent Total” Based on JobDesc I get the correct % for each job, but the Department % is 100%
With “% of Rot Total”, the Department % is correct but the Job codes are wrong. For store 1092, the percents are 3.55%, 2.76%, and 27.11%.
Hey Jeff
Hmmm…I think it may just be how you set up the format. Try the department in the row field, with the job code under it in the row field as well. The % of Parent Row Total should show each job as a % of its parent department and each department as a % of the total. Let me know if that helps you,
Kurt LeBlanc
Due to the layout requirement of the report, I cannot move the jobcodes down into the rows. I have 97 stores in 12 different regions which are down the rows in the report.
Thank you for your help in trying to clear this up.
Hey Jeff,
What percentages do you want to see? Please tell me in general terms, like job codes as a % of the total. I can hopefully help you further that way.
Kurt LeBlanc
Hi,
Would you have any suggestion on how I can calculate the % of parent (total, row and column) if I have a MAC and this feature is unfortunately not available?
Thank you
Sophie
I’m so sorry, but I don’t happen to have a copy of the Mac version handy. But hopefully someone can help out and post a comment.
Hi Jeff,
ok thanks!
Is this feature available in MS Excel for Mac. I don’t see it
Unfortunately I don’t have a copy of Excel for Mac here, I hope someone else can help me out to confirm either way.
Thanks
Jeff
Is there a work around to be able to do this in version 2007?
Thanks! Thanks! Thanks! Today is the second occasion when I’ve landed on your page.
I have been stuck with solving this puzzle on calculating percentage within a sub-group and nearly gave up after trying different hacks and options. Each time I ended up getting values calculated from the main (outermost) group.
Your explanation is easy to comprehend. So instead of just a copy+paste solution, I understood the core of the issue in an unforgettable way. Thanks again!