Excel University Blog
Read on for in-depth articles, tutorials, and videos. Search or browse for specific topics. Be sure to subscribe if you'd like to be notified when we write something new.
Features

Let me ask you a question. How do you know when a user has entered a value into a formula cell, essentially overriding your formula? Since this is Excel, there are several ways to address this issue, but starting with Excel 2013, we can use conditional formatting with the new ISFORMULA function. Objective Our worksheet…
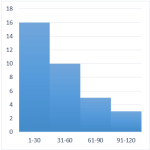
A histogram graphically displays the number of items that fall within equal intervals, or, bins. For example, the number of days with a high temperature between 71-80 degrees, 81-90, and 91-100, the number of students with test scores between 60-69, 70-79, 80-89, or the number of invoices that are due in 31-60, 61-90, or 91-120…

In this post, we’ll examine custom format codes that allow you to get your date values formatted exactly as desired. This post is inspired by Sidney, who asked how to change date formats in Excel. Format Cells To change the format of a date value, select the cell and then open the Format Cells dialog…

Beginning with Excel 2013 for Windows, we can use Slicers to filter table data. In this post, we’ll explore how to use Slicers as a relatively easy alternative to conditional drop-downs. Objective When we want to allow a user to select a choice from a list of items, we often consider using the Data Validation feature to…

The conditional formatting feature of Excel is one of my favorites. In this post, we’ll customize a default rule to create alert icons for our journal entry log that indicate which entries are out of balance. Objective Our objective is to create an alert when a journal entry is out of balance. Since this is Excel, there…

In this post, we’ll check out a few PivotTable formatting techniques that help get our report looking just right. Objective Our objective is to create the following PivotTable report. There are a few formatting points to note about the report. First, the region groups, such as Midwest and Northeast, are in the same column as the…

In this post, we’ll examine a couple of ideas for computing income tax in Excel using tax tables. Specifically, we’ll use VLOOKUP with a helper column, we’ll remove the helper column with SUMPRODUCT, and then we’ll use data validation and the INDIRECT function to make it easy to pick the desired tax table, such as single or married…

Previously, we explored using the INDIRECT function to refer to various tables in a workbook. In this follow-up post, we’ll expand the discussion and refer to individual table columns. Objective Let’s start with our objective. We have several tables in a workbook. They have the same structure and store department data. For example, here is…

In this post, we’ll allow the user to select a table name from a data validation drop-down and our Excel formulas will operate on the values from the selected table. Thanks to Neelima for asking about this technique! Objective Before we get too far, let’s be clear about our objective. We have several data tables in…

In this post, we’ll recreate a heat map presented in Stephen Few’s Information Dashboard Design, 2nd Edition, using an Excel PivotTable and a bit of conditional formatting. Objective Before we get too far, let’s take a look at our objective. We are trying to create a heat map that uses variation in color intensity to…