Excel University Blog
Read on for in-depth articles, tutorials, and videos. Search or browse for specific topics. Be sure to subscribe if you'd like to be notified when we write something new.
Jeff Lenning

The SUBTOTAL is a wonderful alternative to the SUM function, and this post shows how to set up a shortcut button that inserts the SUBTOTAL function. Our new shortcut button will be similar to the AutoSum button that inserts the SUM function because it will automatically include the cells above. Objective Before we get started, let’s…
Microsoft recently released Office 2016, and with it, the next version of my favorite program, Excel. If you would like to get a quick overview of some of the enhancements, please check out this CalCPA Magazine article where I describe the Excel 2016 improvements that caught my eye. Excel 2016 – CalCPA Magazine Article With…

If you have ever wished that the VLOOKUP function could return the sum of two or more related columns, this trick will get you there. Objective Before we get into the details, let’s be clear about our objective. We have some transactions that were exported from our accounting system as shown below. We would like…

When you need to compute a future date and exclude weekends, you may want to consider exploring the WORKDAY function. In this post, we’ll use the WORKDAY function to prepare a simple project plan and then display it with a Gantt chart. Objective We have a project that we are managing and it has several…
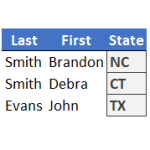
When you need to perform a lookup, your instinct tells you to use VLOOKUP. But, when your lookup uses multiple conditions and columns, you may be inclined to use SUMIFS. However, when the value you need to return is a text string, rather than a numeric value, you are precluded from using SUMIFS since it only…
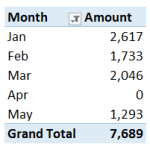
If you have ever created a PivotTable report that groups by month, you may have encountered an awkward situation where the PivotTable only displays the months that actually have data in the source. The PivotTable will summarize the data that exists and if there are no transactions for a given month, the PivotTable won’t display it.…

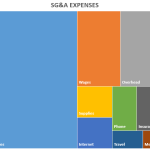
If you haven’t checked out Excel’s conditional formatting feature recently, you’re missing out on some nice enhancements. The feature formats a cell based on its value. Excel continuously monitors the cell value and updates the formatting as the cell value changes. Conditional formatting has traditionally been limited to basic cell formatting such as fill and…
I’m happy to announce the immediate availability of Excel University’s next guest lecture: Xtreme PivotTables by John Michaloudis. Earn 16 CPE hours while learning more about PivotTables…what could be better? This course provides a comprehensive examination of Excel’s PivotTable feature and explores many powerful capabilities. This course digs into so many details that even experienced PivotTable…

With a simple custom format code, we can display negative numbers as positive…but…why would we want to? So that we can simplify our formulas and make our workbooks more reliable of course. Let’s check it out. Objective Before we get to the mechanics, let’s confirm our goal. We have a worksheet, in this case a little…
Alright friends, I have an update about Excel University Volume 4. I’ve just about completed the initial draft, and am very pleased with how it is shaping up so far. Volume 1 is the foundations volume. Volume 2 is where we discuss formula-based reports. Volume 3 is where we cover PivotTable reports. Volume 4 is…