Excel University Blog
Read on for in-depth articles, tutorials, and videos. Search or browse for specific topics. Be sure to subscribe if you'd like to be notified when we write something new.
Jeff Lenning

In this post, we’ll perform a two-dimensional lookup with Excel’s VLOOKUP function. Objective Let’s begin by clarifying our objective and what is meant by the term two-dimensional lookup. We have stored our price list in a table, and the price for each item varies based on the region. This is illustrated in the screenshot below. To…

Did you know that PivotTables can automatically group date fields by month? And by quarter and year? This date group capability makes it easy to summarize data in monthly columns without writing a single formula. Check out my recent California CPA Magazine article for the details. Publication: California CPA Magazine Author: Jeff Lenning CPA Date: May 2015…

Let me ask you a question. How do you know when a user has entered a value into a formula cell, essentially overriding your formula? Since this is Excel, there are several ways to address this issue, but starting with Excel 2013, we can use conditional formatting with the new ISFORMULA function. Objective Our worksheet…

I’m excited to announce the Excel University scholarship program! Excel University will recognize outstanding accounting students enrolled in an accredited college or university in the US, and will provide a $500 cash award as well as free enrollment into our online training program. These scholarships are awarded annually. Please help me spread the word by forwarding…
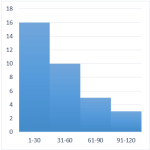
A histogram graphically displays the number of items that fall within equal intervals, or, bins. For example, the number of days with a high temperature between 71-80 degrees, 81-90, and 91-100, the number of students with test scores between 60-69, 70-79, 80-89, or the number of invoices that are due in 31-60, 61-90, or 91-120…

The terms Moving, Rolling, and Trailing are commonly used to describe the same calculation idea…that we want to operate on the previous say 3, 6, or 12 data rows. In this post, we’ll allow the user to define the number of rows to include and use the OFFSET function to dynamically define the desired range. Objective…

If you have a data table that is updated frequently, for example, a new column is added each month, you may want to find the sum of the last three columns. But, you don’t want to rewrite your formula each time you add a new column. Fortunately, you can accomplish this task with two lookup functions,…

In this post, we’ll examine custom format codes that allow you to get your date values formatted exactly as desired. This post is inspired by Sidney, who asked how to change date formats in Excel. Format Cells To change the format of a date value, select the cell and then open the Format Cells dialog…
I’m pleased to announce the introduction of Excel University guest lectures! Until now, all of the Excel University courses were written by a single instructor (me). Moving forward, Excel University will also offer guest lectures by my Excel friends and recognized Excel experts. They will be talking about their areas of interest and expertise. Guest…

Beginning with Excel 2013 for Windows, we can use Slicers to filter table data. In this post, we’ll explore how to use Slicers as a relatively easy alternative to conditional drop-downs. Objective When we want to allow a user to select a choice from a list of items, we often consider using the Data Validation feature to…