Excel University Blog
Read on for in-depth articles, tutorials, and videos. Search or browse for specific topics. Be sure to subscribe if you'd like to be notified when we write something new.
Excel

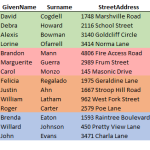
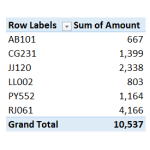
In this post, we’ll create a drop-down that contains a unique list of choices derived from a column that contains duplicate values. This may sound familiar as we previously accomplished this with a PivotTable. However, the Power Query feature that’s built-in to Excel 2016 makes this process easier. Objective We have a data table that contains RepID,…

If you get stock quotes into Excel by typing or copy/pasting from your web browser, you may be able to get your work done faster if you use a built-in Excel feature. Excel’s external data feature enables you to retrieve data from a variety of sources—one of which happens to provide stock quotes. Check out…

Excel easily summarizes flat, tabular data. When data is stored in a crosstab style format instead, Excel users have to spend a bit of time preparing the data for use. There are many ways to accomplish just about any Excel task, but in this post, I’ll demonstrate how to quickly unpivot the data. Thanks to Patrick who…
In this post, I’ll answer a question submitted by reader Chérie about sorting by color. The basic question is this. “I have created a color coded list, where yes=green, no=red, maybe=orange, and other is any other color. How can I sort the list so that all the yes rows are first, then no, then maybe,…

Excel users often spend a bunch of time applying the same format to number cells. Some numbers are stored values and others are calculated with formulas. The task of manually applying the same format to all of the numbers in the worksheet, especially when the numbers aren’t in a continuous range, can feel quite repetitive.…
Excel users find themselves making the same customizations over and over again. This post demonstrates how to store customizations such as cell formatting, headers, print preferences, the default PivotTable style, and cell styles, in a template workbook. Plus, we’ll see how the name and location of the template determines when it is used, and, if it…
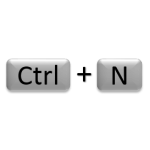
When storing utility macros, Excel users often elect to save them in the Personal Macro Workbook. The advantage is that the macros are available whenever Excel is running. The disadvantage is that if you switch or upgrade computers, you may forget to take a backup of the Personal Macro Workbook and thus lose your macros. In…
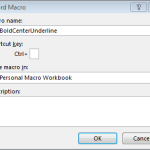
PivotTable users frequently spend time assigning the same number format to PivotTable values. To my knowledge, there isn’t a built-in setting that allows us to define a default value field format. But, it is pretty easy to set up a macro that instantly assigns a desired format. This post walks through the steps of creating such a macro. Objective…

Excel has cell formatting designed just for accountants. Not surprisingly, it is called the Accounting Number Format. The built-in ribbon commands apply the format with two decimals and the currency symbol. This post demonstrates how to set up two handy QAT icons so that we can quickly apply this format with no decimals and without a currency…
If you need to compute the total for certain cells based on their font or fill color, you may have noticed that Excel formulas operate on stored values, not displayed values. That means that functions such as SUM and SUMIFS operate on the underlying cell values and disregard cell formatting, such as font or fill…