
Variance Analysis with the Claude Excel Add-in
Month-end variance reporting is one of those tasks that eats up time every single period. We pull actuals from one source, budget from another, and then manually wire everything together. In this tutorial, we walk through three exercises that show how the Claude Excel add-in can change that workflow entirely. We start by asking Claude a plain-English question about our data, then move into having Claude write the Excel formulas so the report runs automatically every period, no Claude connection required.
Exercise 1: Get a Quick Variance Read from Claude
Let’s say we have two Excel tables sitting on the same worksheet, one called tbl_Actuals and one called tbl_Budget. They come from separate source systems, so they land in separate tables. The goal of Exercise 1 is simple: see if Claude can read both tables and surface the biggest variances without us building a single formula.
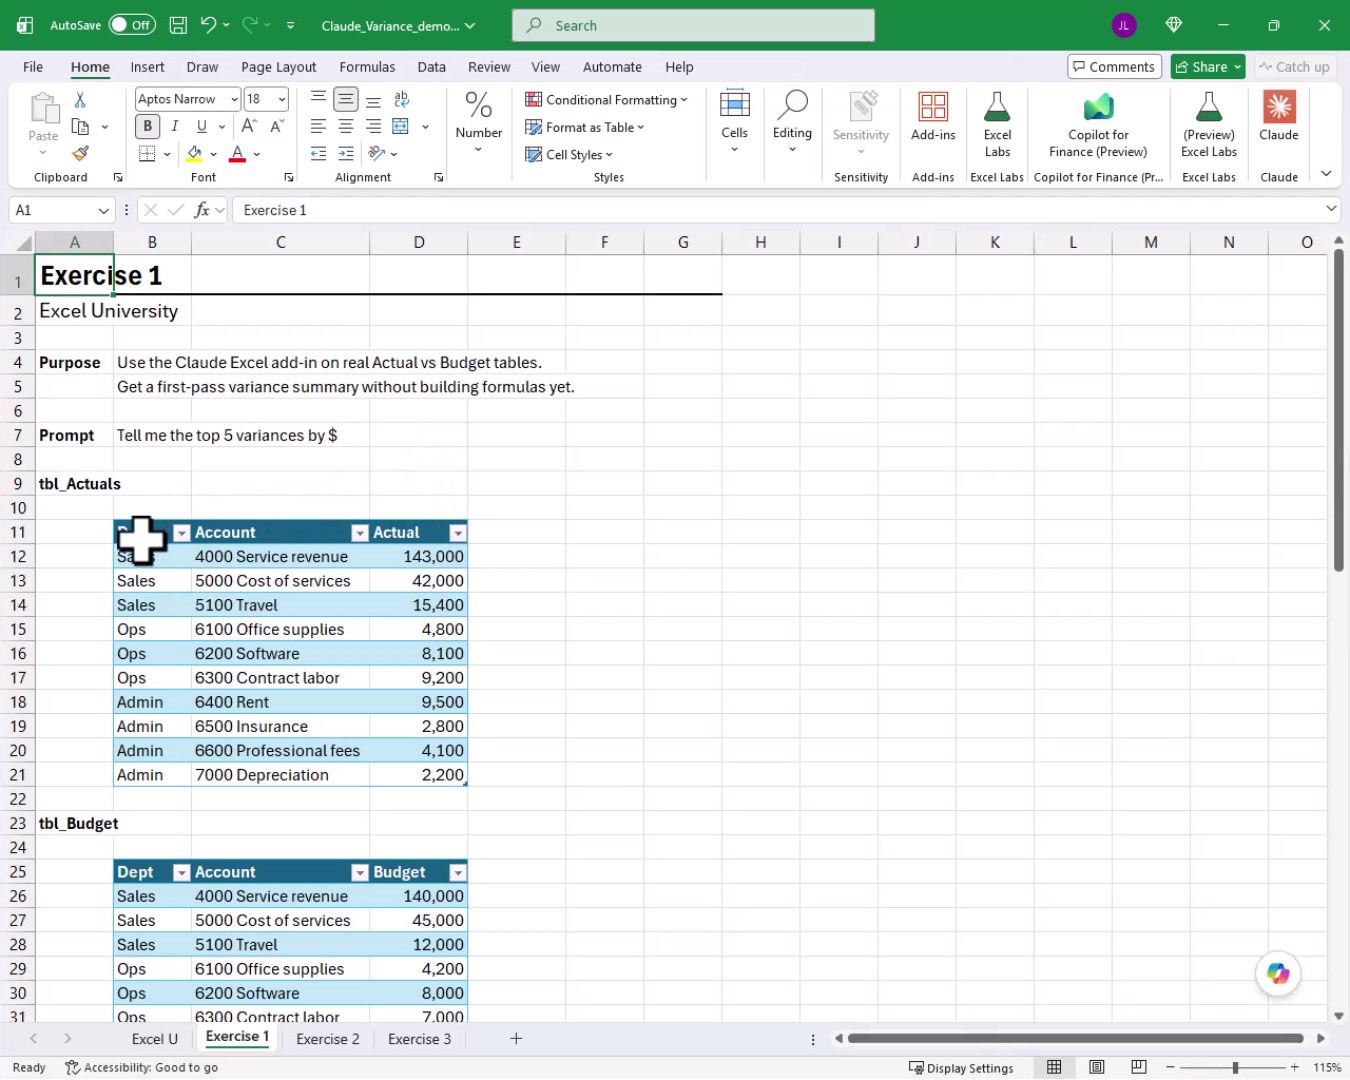
With the Claude add-in open in the task pane, we type a single prompt into the chat box:
tell me the top 5 variances by $
That is the entire prompt. No range references, no column names, no setup instructions. We hit Enter, and bam:
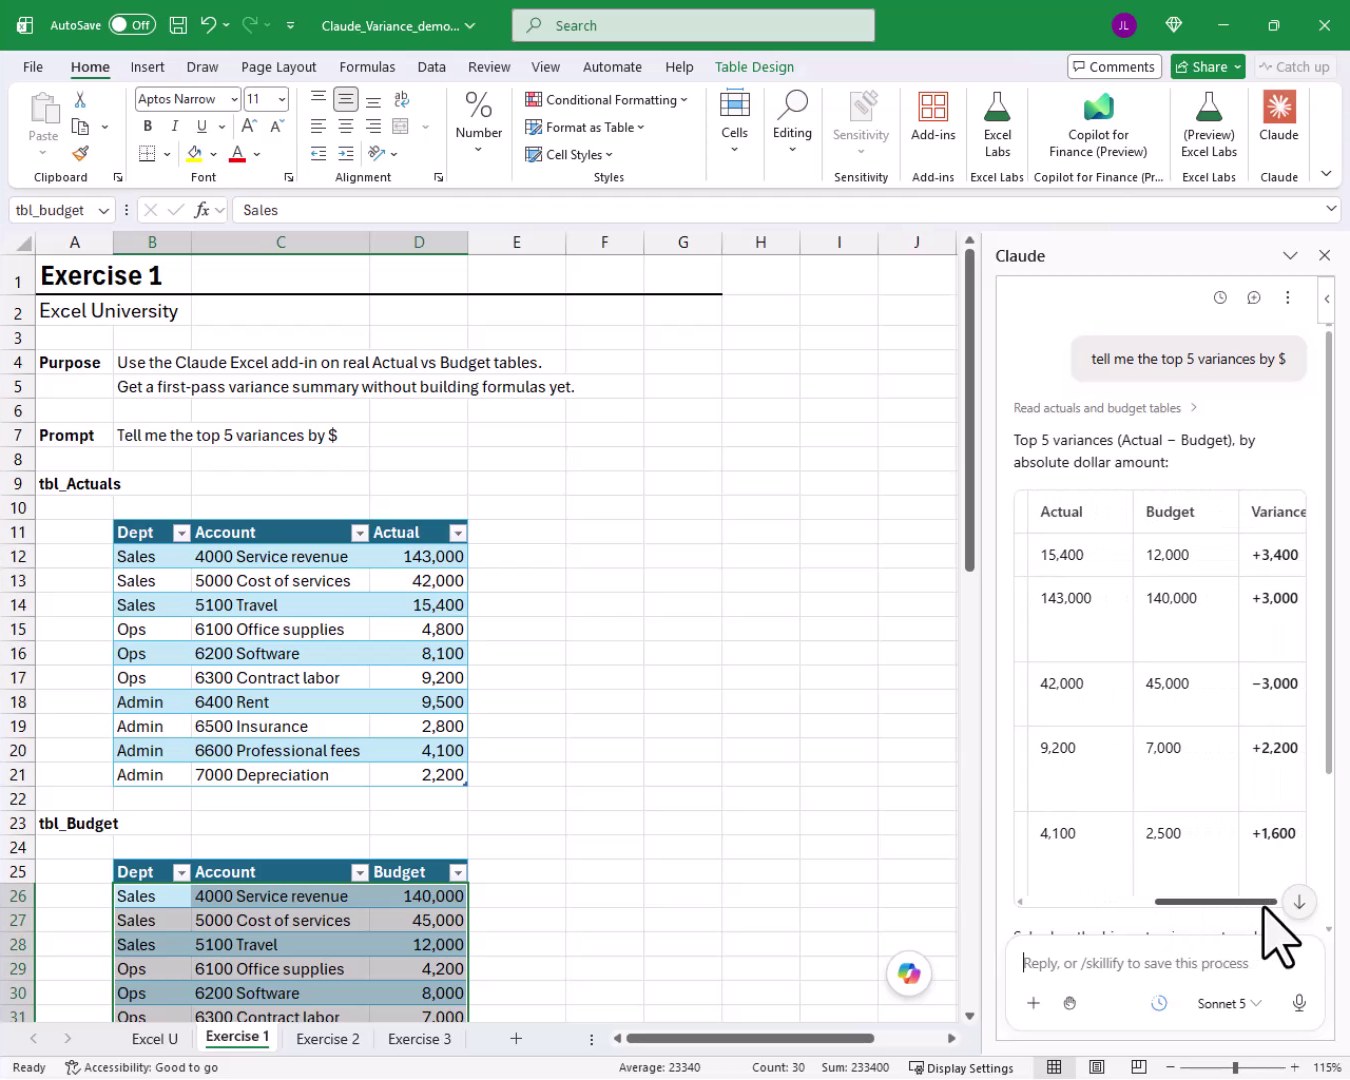
Claude reads both tables automatically, ranks the variances by absolute dollar amount, and returns a clean summary right inside the task pane. No formula needed, no manual lookup, just an answer. This is a great first-pass sanity check before we open the month-end review meeting.
But here is the catch. We do not want to send our data up to Claude every month just to get this answer. What we really want is a set of formulas in the workbook that recalculate automatically whenever we paste in a new period of actuals. That takes us to Exercise 2.
Exercise 2: Have Claude Build the Variance Table with Formulas
Consider the following worksheet for Exercise 2:
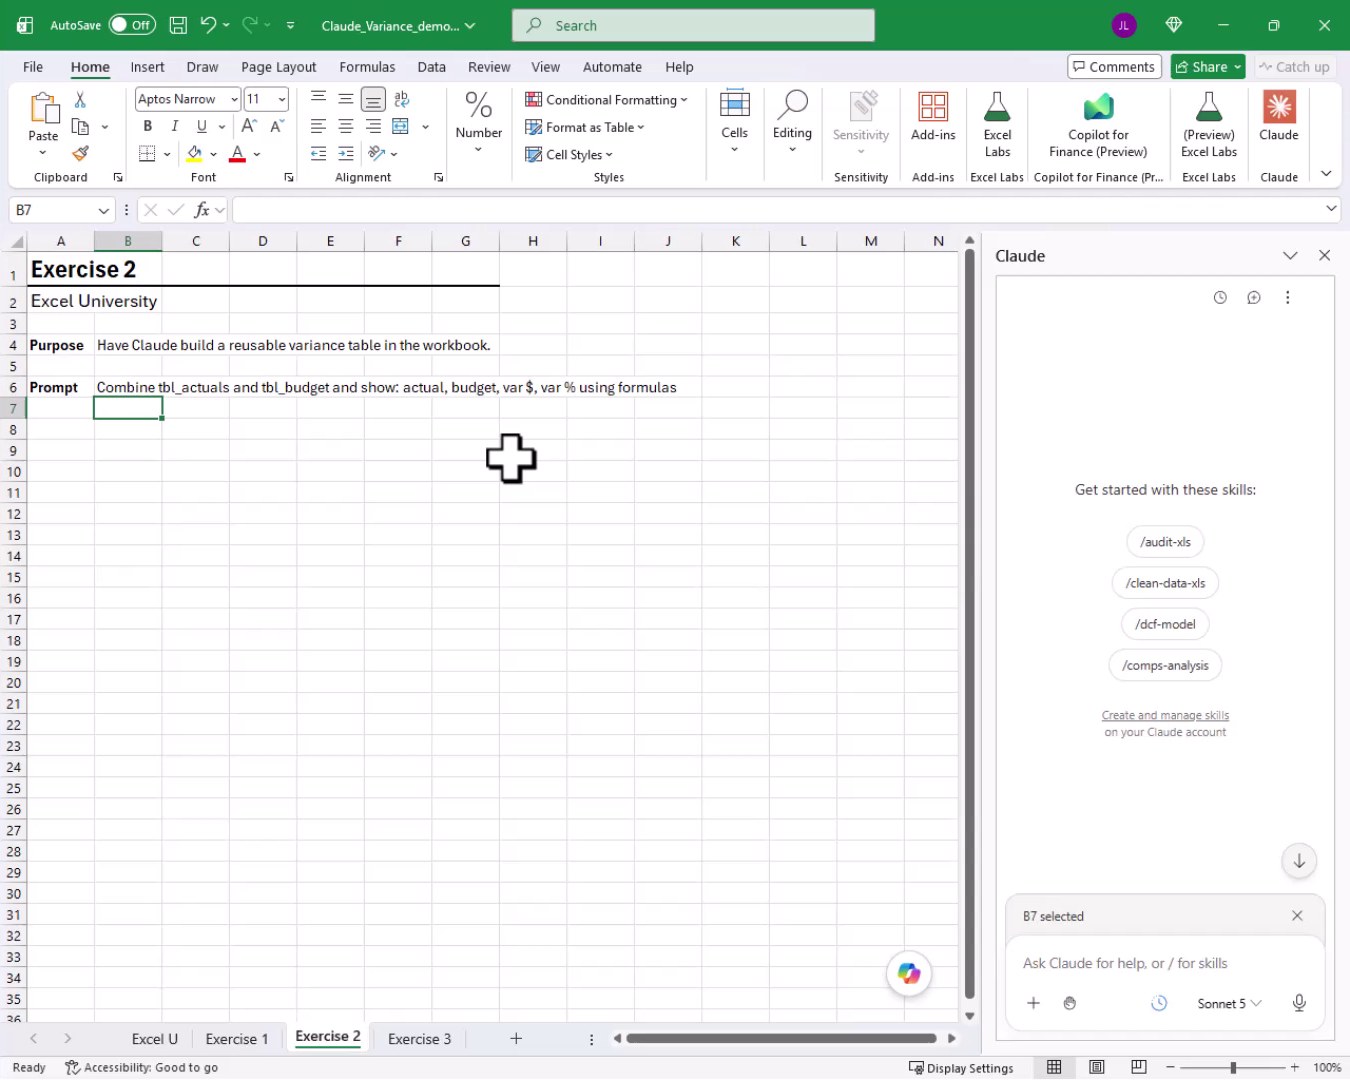
The sheet is empty below the prompt. We want Claude to build the variance table here, and we want it built with formulas so it stays live. We send this prompt:
Combine tbl_actuals and tbl_budget and show: actual, budget, var $, var % using formulas
Claude asks for permission to write to the sheet. We click Always Allow, and bam:
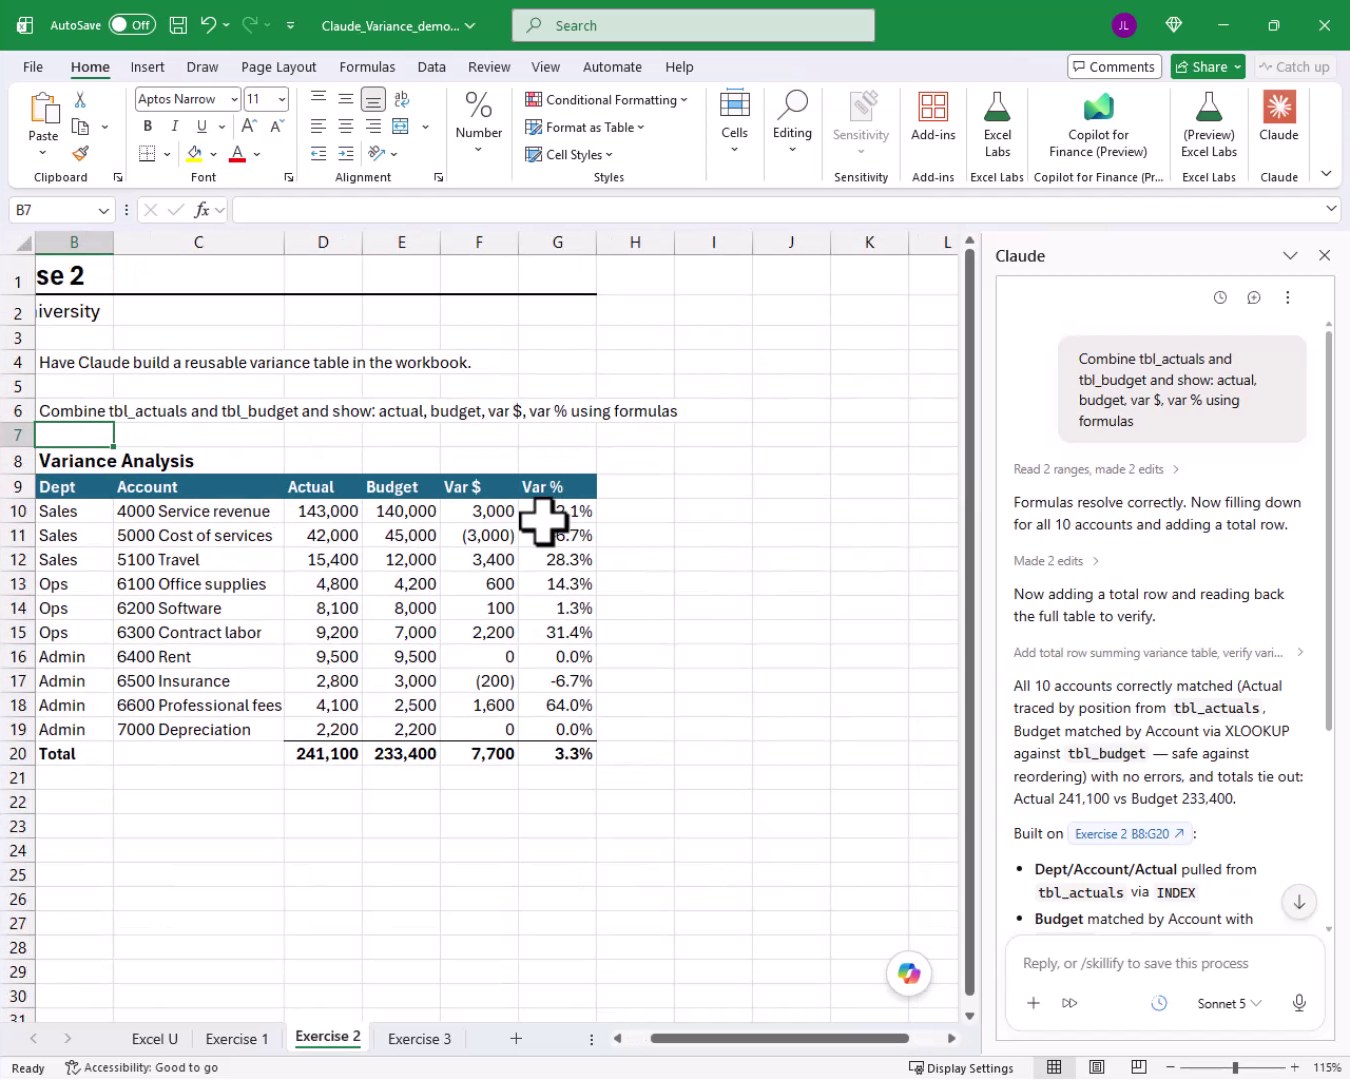
Every cell in the table is a formula. Claude used INDEX to pull Dept, Account, and Actual from tbl_Actuals, and it matched Budget by Account using XLOOKUP against tbl_Budget. That means next period, we paste in fresh actuals and the whole report refreshes automatically, no Claude involved.
Refining Favorable vs. Unfavorable Sign Convention
Looking at the first draft, the sign convention needs a tweak. Revenue that beats budget shows as positive, which is correct. But an expense that comes in under budget also shows as negative, which is confusing. Spending less than budgeted is favorable, so we want that to be positive too. We just tell Claude:
Update this to show favorable variances as positive and unfavorable variances as negative
Claude updates the Var $ formulas. For revenue accounts (account codes starting with 4), it keeps Actual minus Budget. For expense accounts, it flips to Budget minus Actual. We fill the formula down, and bam:
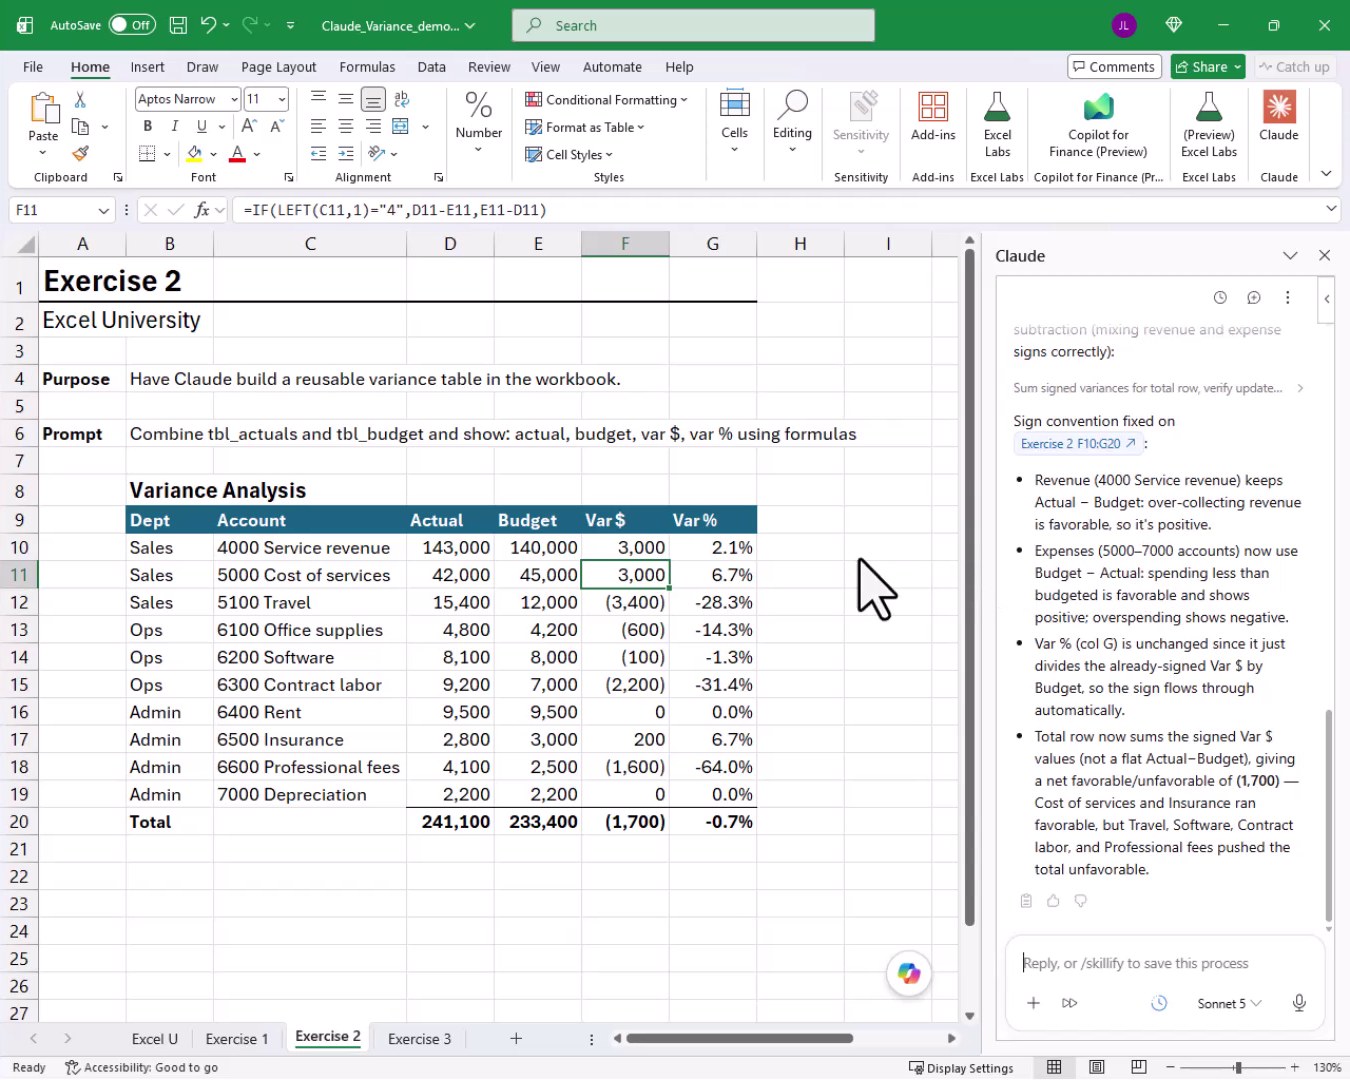
The formula bar shows the IF logic Claude wrote to handle the sign switch:
=IF(LEFT(C11,1)="4",D11-E11,E11-D11)
Revenue accounts start with 4, so those use Actual minus Budget. Everything else flips. It is a clean, readable formula AND it is easy to maintain if the account numbering scheme ever changes. Now we have a fully dynamic, sign-correct variance table, built without writing a single formula by hand.
Exercise 3: Build a Full Month-End Variance Pack
Now it is time to make things more interesting. Exercise 3 takes everything up a level. Rather than one variance table, we want Claude to produce an entire controller-ready reporting pack in a single prompt. Let’s take a look at the Exercise 3 setup:
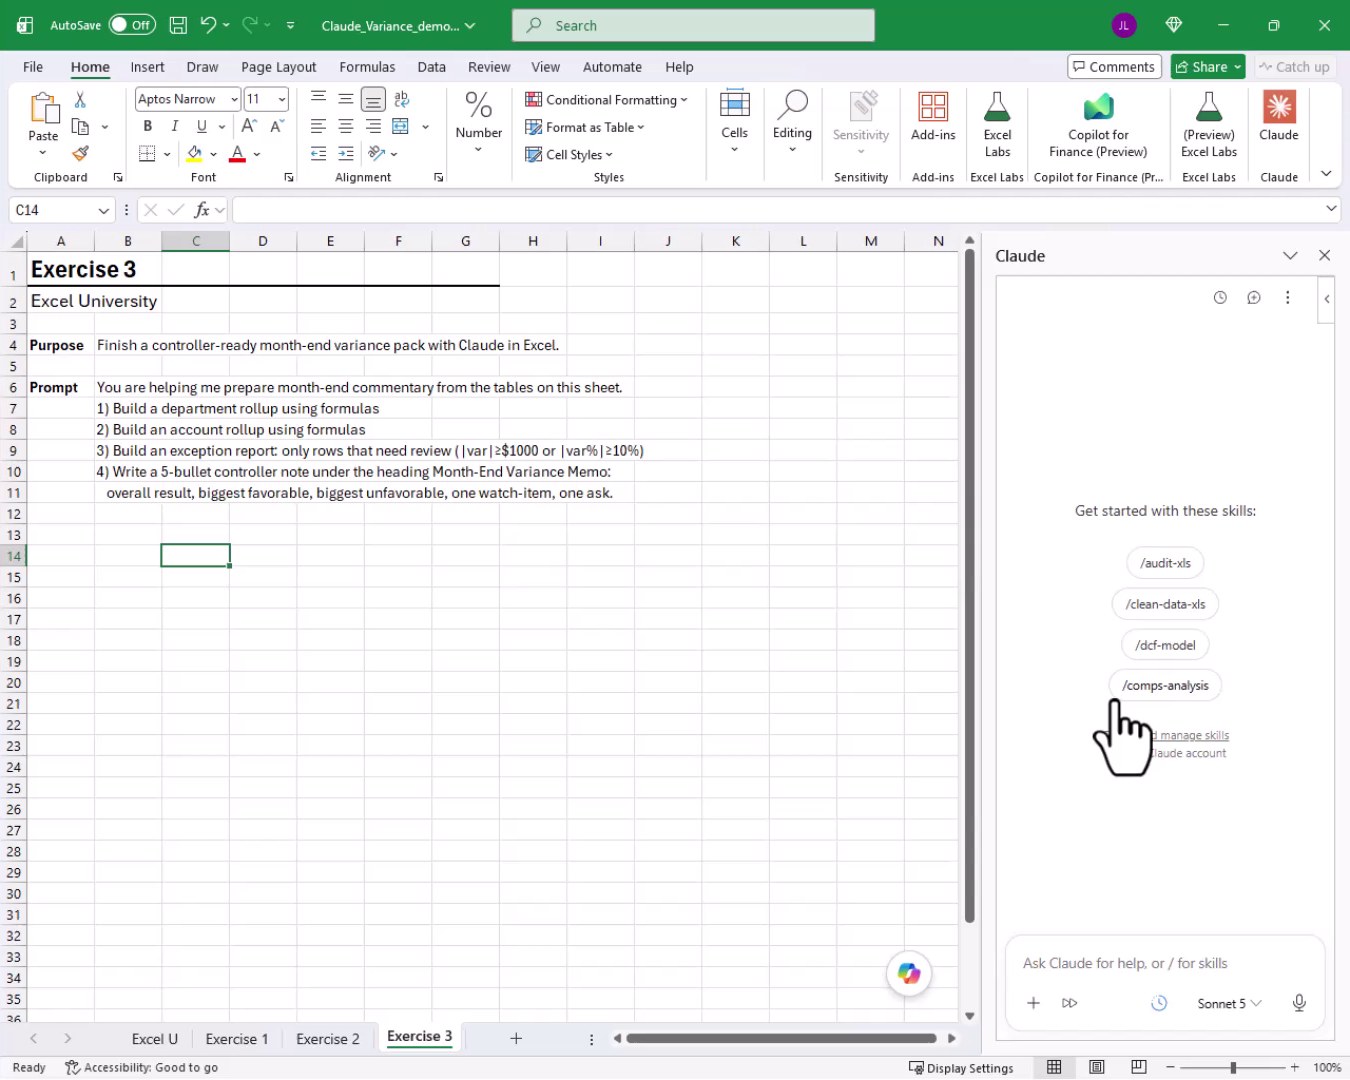
The prompt asks for four deliverables: a department rollup, an account rollup, an exception report flagging variances above a threshold, and a five-bullet controller memo. We copy the prompt, paste it into Claude, and let it run.
Department Rollup and Account Rollup
Before diving in, a quick look at the SUMIFS function. It returns the sum of values that meet one or more conditions. The function arguments are:
- sum_range: the range of values to add up
- criteria_range1: the range to evaluate against the first condition
- criteria1: the condition to apply to criteria_range1
- criteria_range2, criteria2, …: additional range and condition pairs (optional)
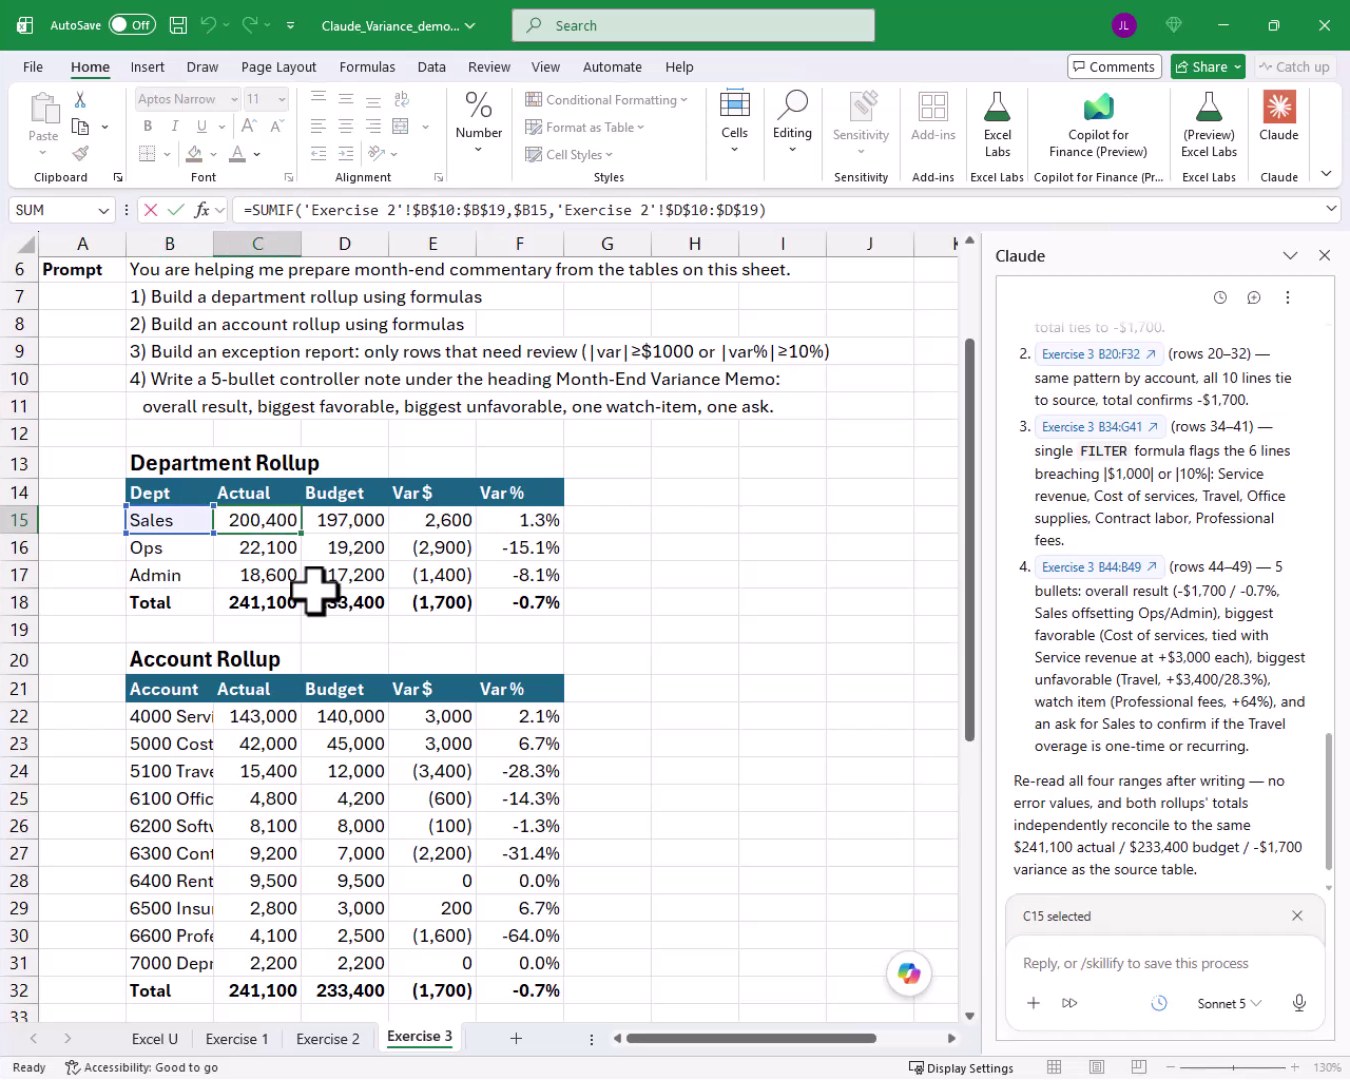
Claude builds the Department Rollup first, grouping all account-level rows into three department totals using SUMIFS. The formula bar confirms it:
=SUMIF('Exercise 2'!$B$10:$B$19,$B15,'Exercise 2'!$D$10:$D$19)
Then Claude adds the Account Rollup directly below. It uses the same SUMIFS pattern, this time grouping by account code rather than department. The formula bar shows it pulling from the Exercise 2 source data:
=SUMIF('Exercise 2'!$C$10:$C$19,$B22,'Exercise 2'!$D$10:$D$19)
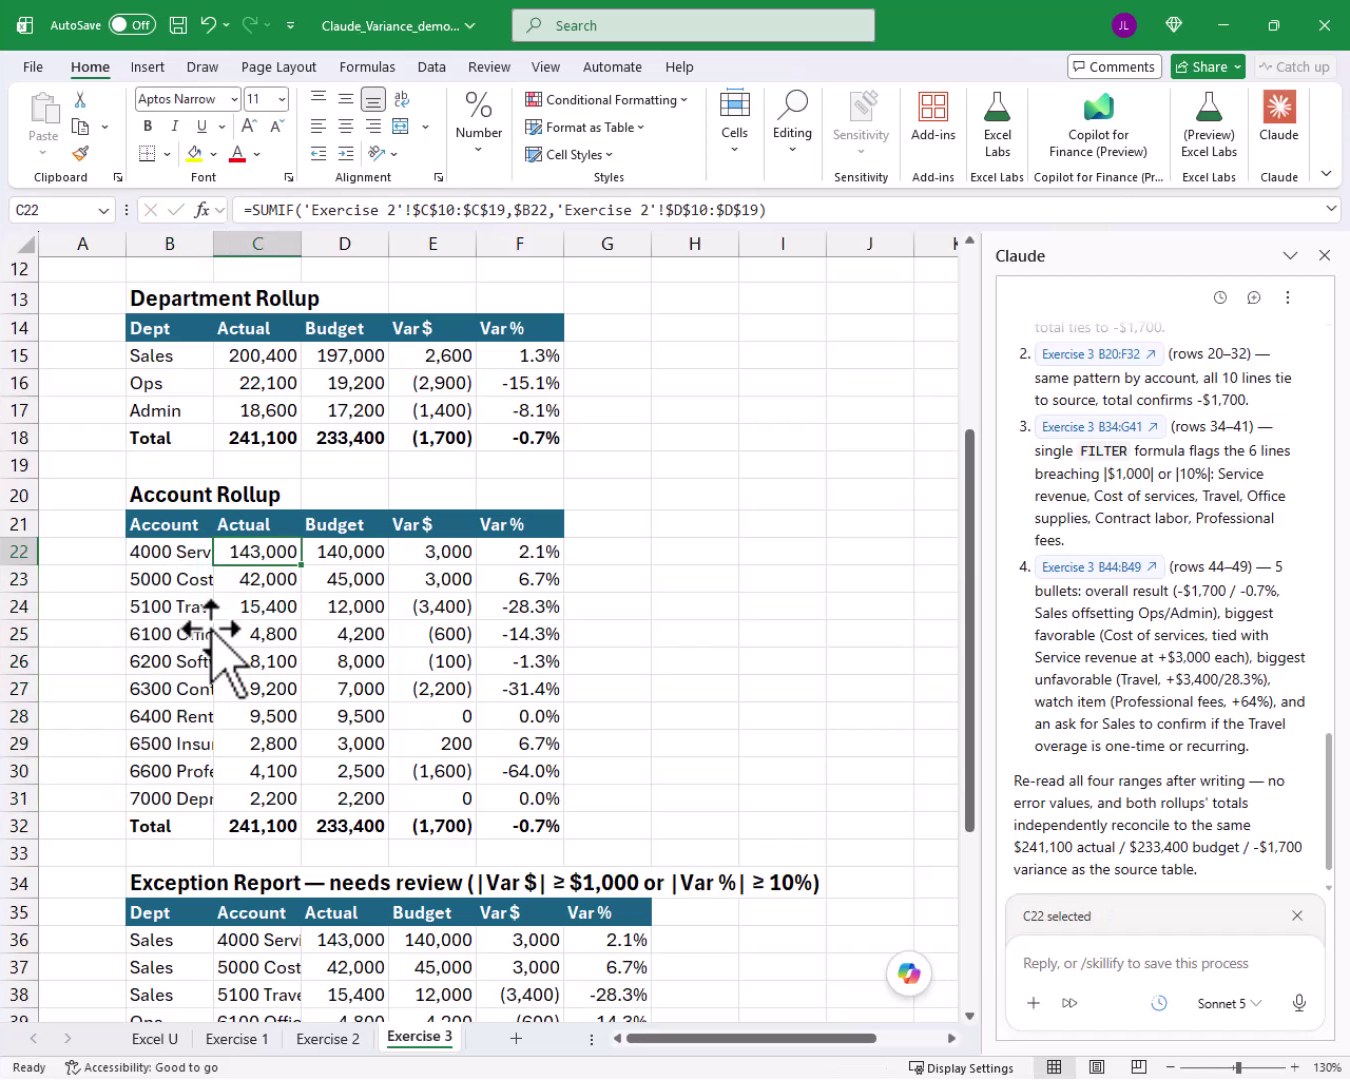
Both rollups carry forward the favorable-is-positive sign convention from Exercise 2. And since they are formulas pointing back to the source tables, updating next month’s actuals cascades through every report automatically.
Exception Report
In case we are new to the FILTER function, it returns a subset of a range based on a condition. The function arguments are:
- array: the range to return rows from
- include: a boolean array the same height as array that tells FILTER which rows to keep
- if_empty: value returned when no rows match (optional)
Since we are about to use IFERROR, here is what it does. It returns a value we specify when a formula produces an error, otherwise it returns the formula result. The function arguments are:
- value: the formula or expression to evaluate
- value_if_error: the value to return if value produces an error
The exception report flags any row where the absolute variance in dollars is at least $1,000 OR the absolute variance percentage is at least 10%. Claude wrote a single FILTER formula wrapped in IFERROR to handle it:
=IFERROR(FILTER('Exercise 2'!$B$10:$G$19,(ABS('Exercise 2'!$F$10:$F$19)>=1000)+(ABS('Exercise 2'!$G$10:$G$19)>=0.1)>0),"No exceptions")
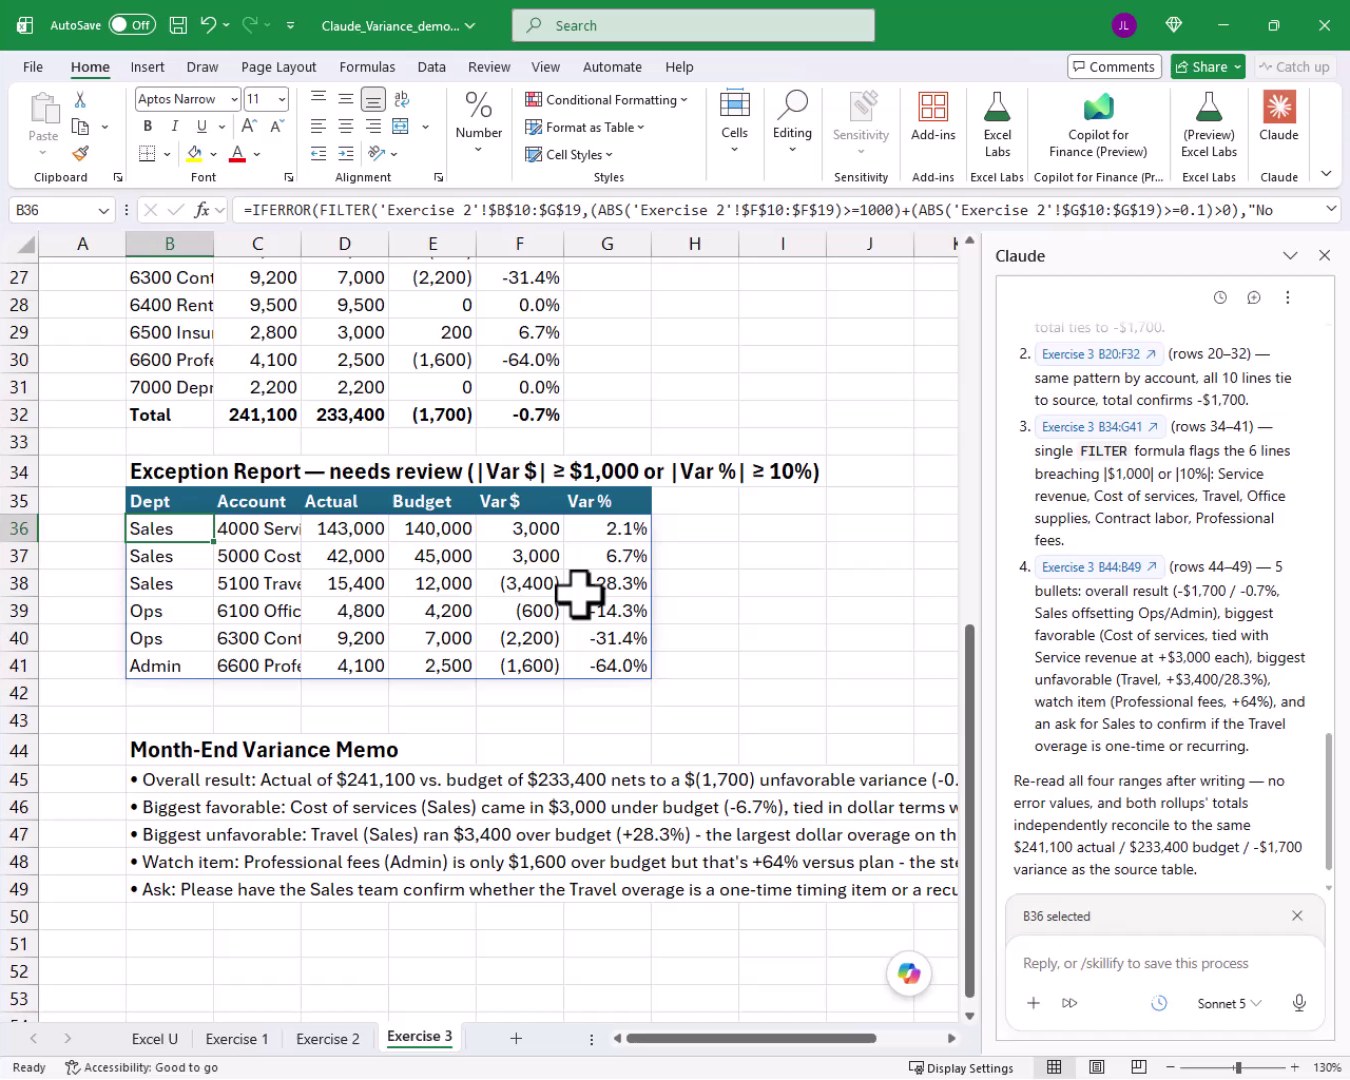
Six accounts make the cut. The FILTER formula returns only those rows, and if nothing breaches the threshold, IFERROR catches the empty result and displays a friendly message instead of an error.
Month-End Variance Memo
Below the exception report, Claude writes a five-bullet controller memo directly into the worksheet cells. Let’s take a look at what it produced:
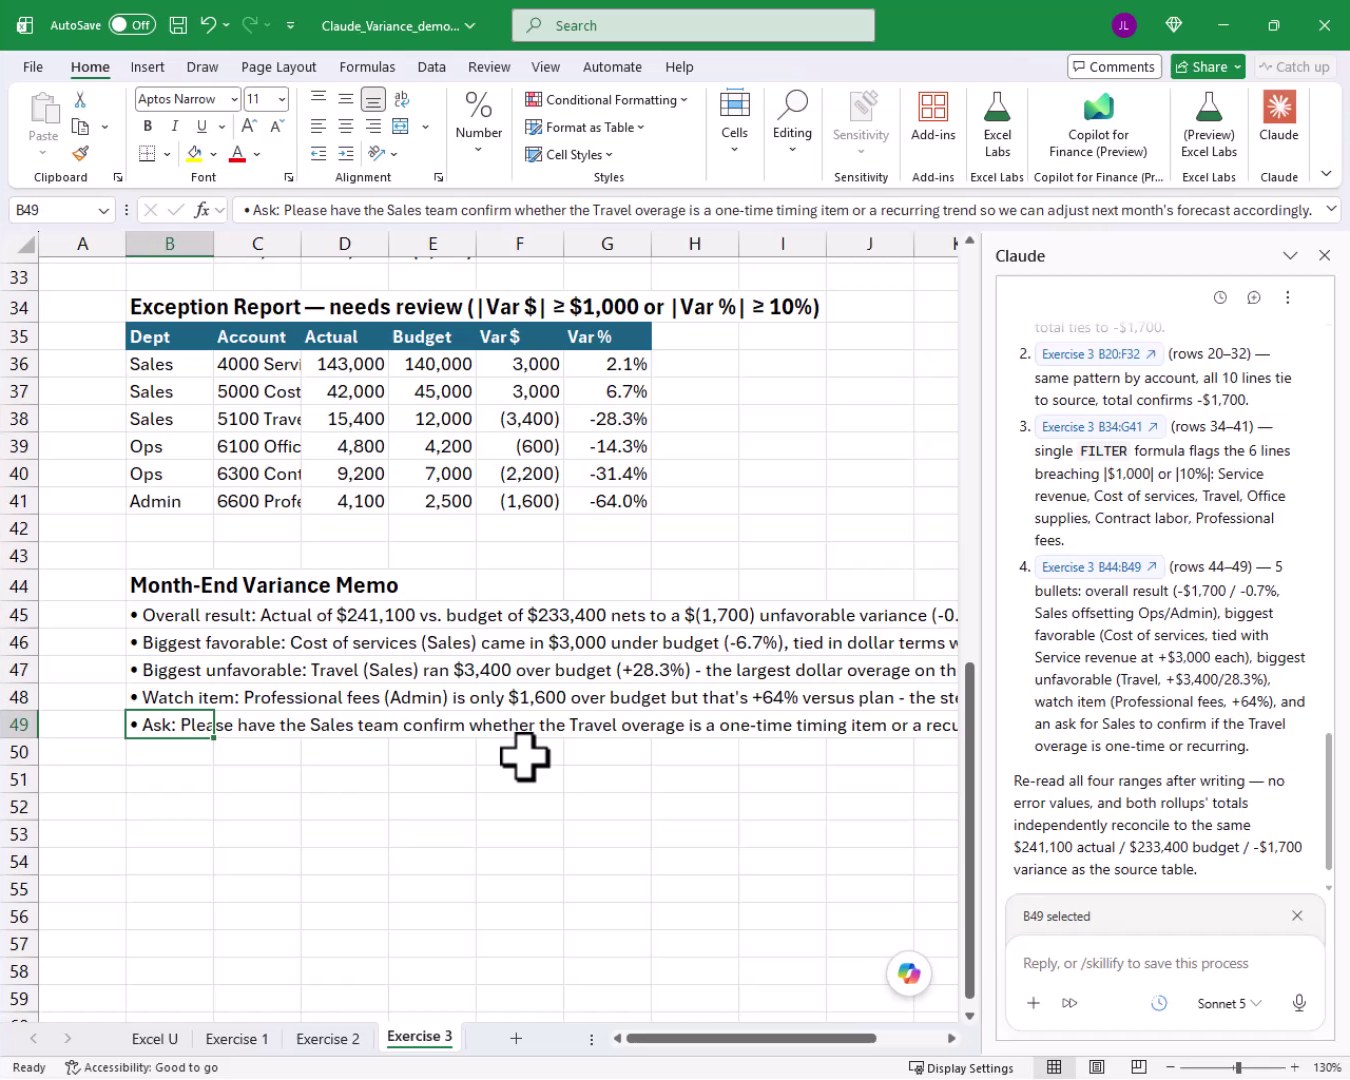
The memo covers the overall result ($241,100 actual vs $233,400 budget, net unfavorable $1,700), calls out the biggest favorable and unfavorable items, flags Professional fees as a watch item at 64% over plan, and closes with a specific ask for the Sales team. That is a controller-ready narrative, written in seconds from our data.
Summary
This tutorial showed three ways to use the Claude Excel add-in for variance analysis. In Exercise 1, we asked Claude a plain-English question and got an instant ranked variance summary. In Exercise 2, we had Claude write the Excel formulas so the variance table is fully automated going forward. In Exercise 3, we handed Claude a multi-part prompt and walked away with a department rollup, account rollup, exception report, and a controller memo, all formula-driven and ready for next period. The sweet spot is using Claude to build the formulas, not to do the analysis every time. Once the formulas are in place, the report runs itself. Mission accomplished!
If you have any suggestions, improvements, alternatives, or questions, please share by posting a comment below … thanks!
Sample File
FAQs
What is the Claude Excel add-in?
The Claude Excel add-in is an AI assistant built by Anthropic that runs inside a task pane in Excel. It can read data from the workbook, answer questions in plain English, and write formulas or values directly to the worksheet when given permission.
Does the Claude add-in require a paid subscription?
Yes. We need an active Claude account to use the add-in. Anthropic offers several plan tiers. Check the Anthropic website for current pricing, as plans and features change over time.
Where do we install the Claude Excel add-in?
We can find it through the Insert tab in Excel, then selecting Add-ins and searching for Claude. It is also available in the Microsoft AppSource marketplace. After installation, a Claude button appears in the ribbon.
Is it safe to send financial data to Claude?
That depends on the data sensitivity and our organization’s policies. Before using any AI tool with real financial data, we should review Anthropic’s data privacy documentation and confirm with our IT and legal teams that the usage complies with company guidelines.
Can Claude write formulas that reference named Excel Tables?
Yes. Claude can read Table names like tbl_Actuals and tbl_Budget and reference them in structured Table references or in standard range formulas. In the exercises above it used both styles depending on what it was building.
What Excel version is required for the FILTER function used in the exception report?
FILTER is a dynamic array function that requires Microsoft 365 or Excel 2021 and later. It is not available in Excel 2019 or earlier versions. If we are on an older version, we would need to build the exception report using a helper column and manual filtering instead.
How does Claude know which accounts are revenue vs. expense?
Claude inferred this based on its training data and the context of the account names and locations within the list.
Will the variance table update automatically when we paste new actuals?
Yes, that is the whole point of Exercise 2. Because every cell in the variance table is a formula pointing back to tbl_Actuals and tbl_Budget, pasting a new period of actuals into those source tables causes the variance report, rollups, exception report, and percentage calculations to recalculate immediately with no manual intervention.
Can we customize the exception report thresholds?
Absolutely. The FILTER formula uses hard-coded thresholds of 1000 and 0.1 (10%). We can replace those with cell references so a manager can type in a different threshold and the exception report updates instantly. We could even prompt Claude to make that change for us.
Can Claude build these reports if the actuals and budget tables are on different sheets?
Yes. Claude can read from multiple sheets in the same workbook and write cross-sheet formula references. We just need to make sure both sheets are open in the workbook and, if they contain named Tables, that the Table names are unique. The formulas Claude writes will include the sheet name in the reference automatically.

Excel is not what it used to be.
You need the Excel Proficiency Roadmap now. Includes 6 steps for a successful journey, 3 things to avoid, and weekly Excel tips.
Want to learn Excel?
Our training programs start at $29 and will help you learn Excel quickly.