Modified Internal Rate of Return MIRR
When it comes to evaluating the performance of investment opportunities in Excel, many of us start with the IRR (Internal Rate of Return) function. While helpful, it carries assumptions that don’t always fit real-world situations … especially when financing costs or different reinvestment options are involved. That’s where MIRR (Modified Internal Rate of Return) becomes a powerful alternative. In this post, we’ll explore MIRR in depth, going step-by-step through practical examples to help us make more accurate investment decisions in Excel.
This post is brought to you by Finatical Software
- QuickBooks Online users! We know how essential Excel is for creating custom reports in the exact format you need. With Finatical, you can pull live, refreshable QBO financial data directly into your favorite Excel reports, no more copy, paste, export, repeat. It’s fast, easy, and built to streamline your workflow.
- A FREE TRIAL is available, so check it out risk-free today!
Video
Why Use MIRR Instead of IRR?
The traditional internal rate of return function (IRR) assumes:
- We do not borrow money for negative cash flows (no financing rate).
- Positive cash flows are reinvested back into the same investment (at the same rate as the IRR itself).
In practice, these assumptions are not always true. We might use a line of credit to fund negative cash flows, or we may move positive cash flows out of the project and into an interest-bearing savings account. The MIRR function allows us to separate and customize both:
- Finance rate: interest rate applied to negative cash flows
- Reinvestment rate: interest rate applied to positive cash flows
Let’s walk through how MIRR works using Excel, and how it can provide more realistic evaluations.
Step-by-Step: MIRR Function
Exercise 1: Basic IRR Review
Let’s start by computing an internal rate of return with the standard IRR function:
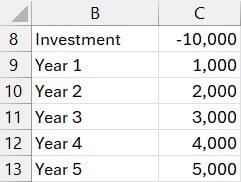
We can using the following to compute internal rate of return in C15:
=IRR(C8:C13)

This gives us an internal rate of return of 12%. However, this assumes all cash flows are reinvested back into this same investment and thus earn the same rate of return (12%). When you do reinvest cash flows back into the investment, great … that assumption is fair.
However, when you pull positive cash flows out, the MIRR function (which computes the modified internal rate of return) can be a better fit.
Exercise 2: Introducing MIRR
We’ll now use the MIRR function to clarify the actual performance of the investment. Suppose:
- Finance Rate (applied to negative cash flows): 6%
- Reinvestment Rate (applied to positive cash flows): 3%
We enter our assumptions into some cells and then use the following formula in C18:
=MIRR(C8:C13, C15, C16)

This formula tells Excel to apply the finance rate to the negative cash flow (initial investment), and the reinvest rate to positive cash flows.
Note: the finance rate in MIRR compounds negative cash flows forward to time 0. Since the initial investment already occurs at time 0, it isn’t affected by the finance rate.
The result: MIRR is 9.3% which is a more accurate picture of the investment’s performance under these real-world assumptions.
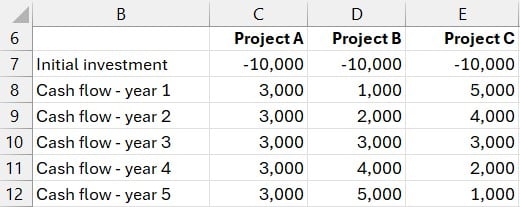
Exercise 3: Comparing Investments
Let’s evaluate three projects. Each requires a $10,000 investment and returns $15,000, but their payout timing differs as follows:
Let’s first calculate internal rate of return for each project with the IRR function:

On surface, Project C wins big. It gives us more cash up front, and due to the time value of money (money today is worth more), that makes sense. But what happens when we factor in different cost and reinvestment assumptions?
Let’s document our finance and reinvestment rates, and then compute the modified internal rate of return with MIRR:
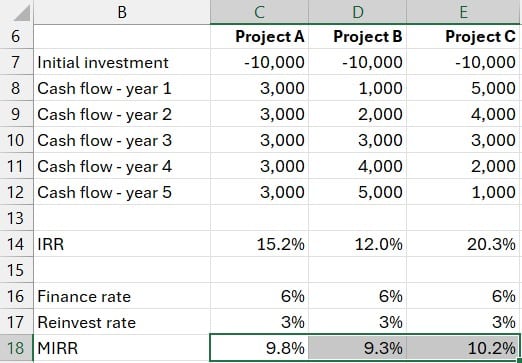
Interesting, our project rankings shifted. While Project C still leads, the gap between all three is much narrower. This demonstrates how the assumptions we make around reinvestment and financing can change our interpretation.
Summary
The MIRR function delivers a more nuanced and often more realistic evaluation of an investment than IRR alone. By enabling us to factor in both the cost of financing and the expected reinvestment return, it reflects the actual economic performance under real-world conditions. When we’re comparing projects or weighing funding strategies, this can provide more strategic insight.
Download the Excel Workbook
Frequently Asked Questions (FAQs)
- 1. What does MIRR stand for?
- MIRR stands for Modified Internal Rate of Return. It adjusts for costs and reinvestment returns to provide a more accurate measure of an investment’s profitability.
- 2. How is MIRR different from IRR in Excel?
- Unlike IRR, MIRR allows us to specify a finance (borrowing) rate and reinvestment rate, giving us control over key assumptions that IRR takes for granted.
- 3. When should we use MIRR over IRR?
- Use MIRR when we want to reflect the cost of financing and assume that cash flows are reinvested at a rate different from IRR. It’s especially useful for comparing projects more realistically.
- 4. Can MIRR be higher than IRR?
- Yes, it can be higher or lower than IRR depending on the finance and reinvestment rates we provide. Typically, if the reinvest rate is lower than IRR, MIRR will also be lower.
- 5. What happens if finance and reinvestment rates are set to 0%?
- If both are set to 0%, MIRR will typically yield results much lower than IRR, possibly even negative, reflecting that neither borrowing nor reinvesting earns additional value.
- 6. Can we use MIRR with irregular cash flows?
- No. MIRR, like IRR, assumes periodic cash flows.
- 7. What’s a typical reinvest rate assumption?
- Use a reinvest rate that reflects where we’d actually place intermediate cash flows in a savings account or perhaps a conservative CD, typically lower than project returns.
- 8. Can MIRR cause us to choose a different project than IRR?
- Absolutely. As we saw in the example, IRR may favor projects with early returns, while MIRR can shift rankings when finance and reinvestment costs are considered.
Disclosures and Notes
- This is a sponsored post for Finatical Software. All opinions are my own. Finatical Software is not affiliated with nor endorses any other products or services mentioned.
- 100% of sponsor proceeds fund the Excel University scholarship and financial aid programs … thank you!
Excel is not what it used to be.
You need the Excel Proficiency Roadmap now. Includes 6 steps for a successful journey, 3 things to avoid, and weekly Excel tips.
Want to learn Excel?
Our training programs start at $29 and will help you learn Excel quickly.