
In Memory of Jeff Sharp: The CUBE Function Example
This post is dedicated to the memory of Jeff Sharp, an active member of the Excel University community and a generous contributor who freely shared his knowledge with fellow Excel enthusiasts. Last year, he sent me this CUBE function example he built, suggesting it might make a good blog post. Jeff, this one’s for you.
The Scenario: Dynamic BOM Lookup
Imagine you have a Bill of Materials (BOM) table with multiple assemblies, each containing various components.
Conceptually, it looks a little like this:
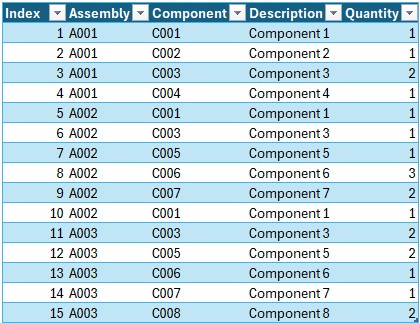
You want to type an assembly code into a cell and instantly see a filtered, dynamic list of its components, descriptions, and quantities with no VBA, no helper columns, pure formulas. You want something like this:
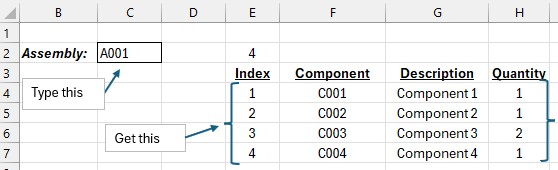
Now, if your data was in an Excel table, you could easily accomplish this with the FILTER function.
However, Jeff often worked with massive data sets that came into his workbooks through Power Query and sat in the data model.
So, what happens if you have a gigantic data set which is in the data model and not inside an ordinary Ctrl+T table? That is when Jeff’s CUBE function approach with dynamic arrays is just awesome.
The Setup (7 Steps)
Here’s the process Jeff documented in his workbook:
1. Add data to the data model. Load your source table into Power Pivot.
2, Add an index column if not already included. This gives each row a unique identifier.
3. Create Measures in Power Pivot for each column you want to return: m_Component, m_Description, and m_Quantity.
4. Enter the CUBESET formula into a cell to filter the data model by assembly:
=CUBESET("ThisWorkbookDataModel","EXISTS([BOM].[Index].[Index],[BOM].[Assembly].&[" & $C$2 & "])","Index")This returns a set of index values that belong to the selected assembly.
5. Enter CUBESETCOUNT to see how many rows matched:
=CUBESETCOUNT(E3)6. Enter BYROW/LAMBDA/CUBEVALUE to spill the actual values for each measure:
=BYROW($E$4#,LAMBDA(x,CUBEVALUE("ThisWorkbookDataModel",x,"[Measures].[m_Component]")))7. Repeat for the other measures (Description and Quantity) using the same BYROW pattern:
=BYROW($E$4#,LAMBDA(x,CUBEVALUE("ThisWorkbookDataModel",x,"[Measures].[m_Description]")))=BYROW($E$4#,LAMBDA(x,CUBEVALUE("ThisWorkbookDataModel",x,"[Measures].[m_Quantity]")))Why This Is Brilliant
Most Excel users keep Power Pivot and dynamic arrays in separate mental buckets. Jeff’s example shows they work beautifully together:
- CUBESET reaches into the data model and filters it based on a cell value
- CUBESETCOUNT tells you the size of the result
- BYROW + LAMBDA + CUBEVALUE spills the filtered data dynamically—no fixed ranges, no manual adjustment
Change the assembly code and the entire output updates instantly. It’s a mini-dashboard powered entirely by formulas.
When to Use CUBE vs. FILTER
If your data lives in a worksheet table, use FILTER. Something like =FILTER(Table1, Table1[Assembly]=C2) handles this scenario in one formula and is easy to set up.
But CUBE functions win when your data lives in the data model, which is the common real-world pattern. When you connect to a SQL database, an API, or a large file through Power Query and load it only to the data model (not to a worksheet), FILTER can’t see it. CUBE is your only formula-based option to pull values out of the model and onto a sheet.
Use FILTER when:
- Your data is in a worksheet table
- The dataset is small enough to live on a sheet
- You don’t need relationships between multiple tables
Use CUBE when:
- Your data comes through Power Query and loads only to the data model
- The dataset is too large for a worksheet (millions of rows)
- You have multiple related tables in the model
- You need DAX measures (running totals, time intelligence, complex aggregations)
- The data model already exists for PivotTables or Power BI
Jeff’s example uses a small table to teach the technique, but the real power shows up when you’re pulling from a model that has no worksheet footprint.
Download the Workbook
Jeff’s original workbook is available for download so you can explore the formulas and data model yourself.
Thank You, Jeff
Jeff Sharp exemplified the spirit of the Excel community: build something cool, then share it so others can learn. His contribution lives on here, and we’re grateful he took the time to put this together.

Excel is not what it used to be.
You need the Excel Proficiency Roadmap now. Includes 6 steps for a successful journey, 3 things to avoid, and weekly Excel tips.
Want to learn Excel?
Our training programs start at $29 and will help you learn Excel quickly.