How to Supercharge Your Excel Reporting with the Claude Add-In
In this post, we’ll walk through the game-changing workflow of using the Claude add-in for Excel to quickly generate first drafts for complex reports. Whether you need summarized spending, budget vs. actual analyses, or executive-ready management dashboards, the Claude add-in accelerates data transformation while leaving us firmly in control of accuracy and customization.
Video
What Is the Claude Excel Add-In?
The Claude Excel add-in connects AI directly to your workbook, allowing us to prompt report creation, data checking, and even advanced formatting from a side panel. Think of it as a knowledgeable assistant: generating the skeleton, handling formulas or pivot tables, and letting us focus on validation and refinement.
Let’s break down exactly how we can leverage Claude, from installation through reporting and spot-checking, with clear steps and practical recommendations.
Step 1: Installing and Logging into the Claude Add-In
Getting started is straightforward:
- In Excel, go to the Insert tab and select Add-ins.
- Search for “Claude” and click Add to install.
- Open the Claude side panel and log in with your Claude account credentials.

Pro Tip: Always verify permissions and ensure the add-in is enabled in your workbook.
Step 2: Exploring the Data Structure
For demonstration, we’ll use a sample workbook with two sheets:
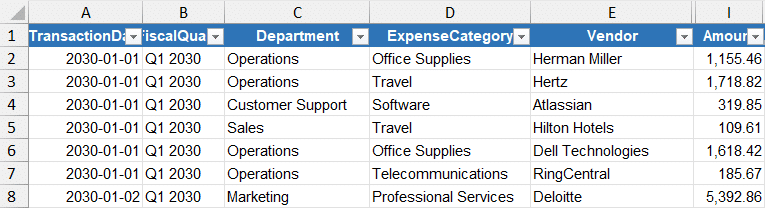
- Data: Contains transactional actual expenses (columns include date, department, expense category, vendor, payment method, amount, etc.).
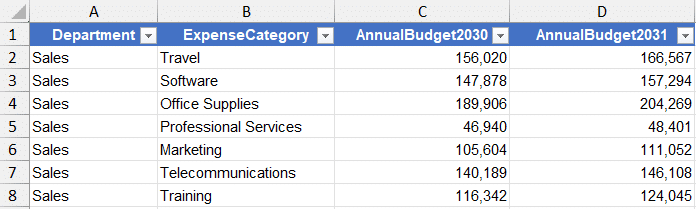
- Budget: Holds budget data per department and expense category, with annual budget columns for two years (e.g., 2030 and 2031).
Here is a partial screenshot of each.
Data sheet:
Budget sheet:
Step 3: Creating a Departmental Spending Report
Prompting Claude for a Summary
To create a pivot-style summary of total spending by department, grouped by expense categories, we simply enter the following prompt in the Claude pane:
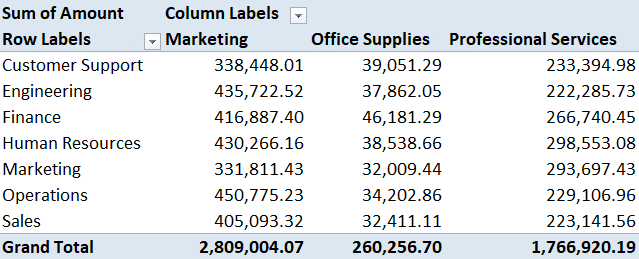
"Build a pivot-style summary showing total spending by department with columns for expense categories."
After processing, Claude documents its actions in the side panel. The output is a formula-based table leveraging SUMIFS to total amounts by department and category.

Always Spot-Check AI Results
Never blindly trust automated results—AI can make logical mistakes or misinterpret complex setups.
Best practice: Add a “tie out” section by prompting Claude:
"Add a tie out to compute the total per data tab and compare to total per report."
Claude inserts formulas comparing the report total with the raw data total, using conditional formatting to visually confirm agreement. This single check ensures our summary aligns accurately with source data.

Step 4: Generating PivotTables Automatically
If we prefer a PivotTable, prompt Claude with:
"I want a PivotTable, not a formula-based report."
Claude creates a standard PivotTable with:
- Rows: Department
- Columns: Expense Category
- Values: Sum of Amount
It even updates the tie out to compare PivotTable totals with source data, reinforcing best practices for validation.
Step 5: Budget vs. Actual Analysis Across Tabs
For more advanced reporting, such as a “budget vs. actual” by department (with variance columns and alerts for overspending), prompt Claude:
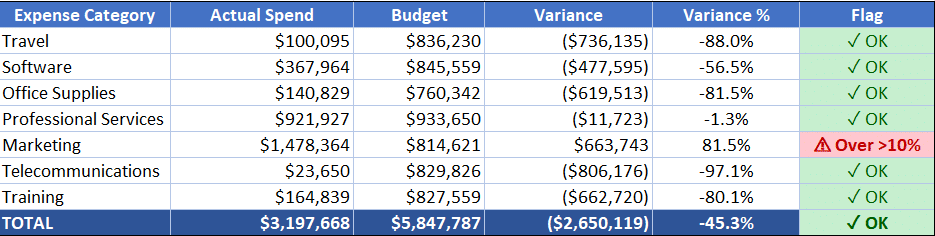
"Create a budget vs actual comparison by department. Add columns for budget, variance, and variance percent. Flag any category where actual spending exceeds budget by more than 10%."
Claude pulls actuals from the data tab and budgets from the budget tab, linking by department and expense category.
Always verify: Never blindly trust AI! Confirm it is matching budget and actuals by the same year.
Step 6: Creating an Executive Management Report
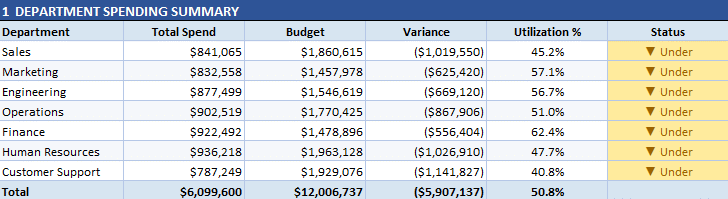
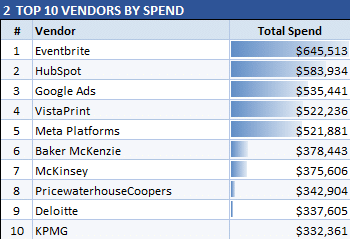
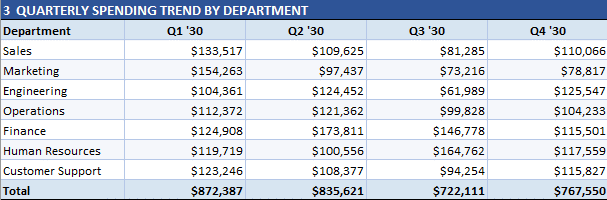
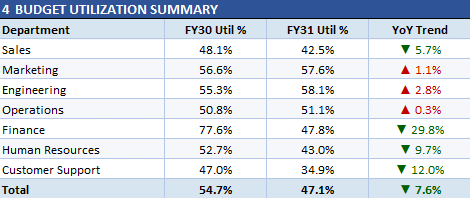
For a management-ready dashboard summarizing departmental spend, top vendors, quarterly trends, and budget utilization, prompt:
"Prepare a one-page management report that includes a department spending summary, top 10 vendors by total spend, quarterly spending trend by department, and a budget utilization summary formatted for executive review."
Claude responds with a multi-section sheet, often including summary tables, conditional formatting, and even representative charts for at-a-glance insight.
Refining Reports: My Workflow
- Spot-check totals and tie outs at each step
- Adjust column widths for readability
- Rearrange output for clarity and executive presentation
- Update prompts iteratively for exactly the view we want (e.g., by year, by category, with or without departments)
The Claude add-in handles the heavy lifting for initial drafts, letting us play to our strengths as analysts: validating, customizing, and fine-tuning.
Summary
The Claude Excel add-in expedites report creation whether for departmental summaries, advanced budget vs. actuals, or executive dashboards. Use it for quick first drafts. Then rigorously spot-check it validating formulas. AI is a springboard, not a substitute for expert oversight. With Claude, that balance is easier than ever.
And remember … never ever blindly trust AI.
File Download
Frequently Asked Questions
- Q1: What is the Claude add-in for Excel?
- The Claude add-in brings AI-powered report generation and data analysis directly into Excel, letting us generate summaries, pivots, tie outs, and visualize data with simple prompts.
- Q2: Is the Claude add-in free?
- The Claude add-in requires a Claude account, which may be free or paid depending on current policies. Check the developer’s website for up-to-date details.
- Q3: How do I spot-check reports generated by Claude?
- Always compare aggregate totals and run tie outs between source data and report tables; leverage built-in conditional formatting and cross-sheet formula checks for confidence.
- Q4: Can Claude create PivotTables as well as formula-based reports?
- Yes, simply specify your preference in your prompt for either PivotTables or formula-based summaries.
- Q5: How do I ensure Claude is only summarizing data for one year?
- Specify the year in your prompt, or configure the report to use a dynamic cell or slicer as a year filter. Always validate the results post-generation.
- Q6: What happens if Claude misinterprets my data?
- Edit your prompt for greater clarity, or review and adjust formulas manually after generation. Always double-check the logic and results.
- Q7: Can I use Claude for executive-level dashboards?
- Yes, Claude can automate first-draft management reports, including visualizations and summaries tailored for executive use. Final arrangement may require manual adjustments.
- Q8: How do I install the Claude add-in?
- Head to Insert > Add-ins in Excel, search for “Claude”, and follow the prompts to install. Log in with your Claude account.
- Q9: Is my data secure with Claude?
- Check the privacy and security policy of the Claude add-in and service. Avoid sharing sensitive information with any AI without proper review.
- Q10: Can Claude handle multiple data sources within one workbook?
- Yes, Claude can reference multiple tabs (e.g., data and budget), and generate cross-sheet analyses, provided your prompts are clear about where to pull from.
Excel is not what it used to be.
You need the Excel Proficiency Roadmap now. Includes 6 steps for a successful journey, 3 things to avoid, and weekly Excel tips.
Want to learn Excel?
Our training programs start at $29 and will help you learn Excel quickly.