Weather 2
Create a Dynamic Weather Forecast in Excel
This is the second post in the Weather series. In this post, we’ll walk through how to build a dynamic weather forecast tool using Excel and Power Query. By the end, we’ll be able to simply click Refresh, and Excel will pull in the latest weather forecast based on a specified city and state—right into our worksheet grid.
In the previous tutorial (“Weather 1”), we covered how to retrieve latitude and longitude using Excel’s Geography data type. Now, we’ll use that information to connect to a weather API, retrieve JSON-based forecast data, and present it neatly in Excel.
Video
Overview of Our Weather Forecast Workflow
Here’s the plan in a nutshell:
- Get the latitude and longitude for a location.
- Use it to generate a URL for a weather API request.
- Extract the actual forecast URL from the response.
- Use that forecast URL to retrieve and display structured forecast data.
Step-by-Step Guide: Pulling Weather Data into Excel
Step 1: Combine the Base URL with Latitude and Longitude
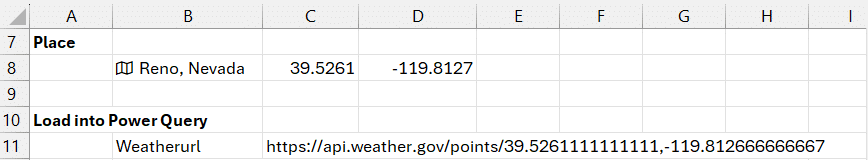
We’ll start by manually constructing the API URL. In an Excel cell, we’ll use the CONCAT function to join the base URL with the comma-separated latitude and longitude. Assuming we grabbed the latitude and longitude via the Geography data type:
=CONCAT("https://api.weather.gov/points/", C8, ",", C9)Let’s name this cell weatherURL for easy access in Power Query. You can do this using the Name Box just above the grid to the left of the formula bar.
Step 2: Load the Weather URL into Power Query
- Select the named cell
weatherURL. - Go to the Data tab, and click From Table/Range.
- Disable headers and delete any automatic data type changes.
- Right-click the value and choose Drill Down. This converts the query into a scalar text value.
- Close & load to: choose Connection only.

This step makes the dynamic URL available for the next query.
Step 3: Retrieve the Forecast URL
- In Data → Get Data → From Web, paste the text URL created above.
- When retrieving the data, open the response as JSON.
- Expand the
propertiesrecord and drill into it. - Locate the
forecastproperty (which itself is a URL). Right-click that and choose Drill Down. - Save this as another connection only query, name it
forecastURL.

Step 4: Retrieve the Real-time Forecast
- Go back to Data → Get Data → From Web and paste in the forecastURL.
- Again, parse as JSON.
- Navigate to
properties → periods. - Convert
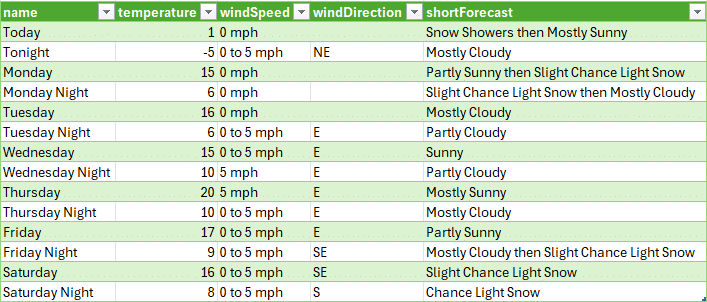
periodsto a table, using default settings. - Expand the record to include forecast attributes like
name,temperature,shortForecast, etc.
Tip: Uncheck “Use original column name as prefix” when expanding for cleaner headers.
Step 5: Clean Up the Data
Select the columns you need and remove the unnecessary ones. For example, you might keep:
- Name (e.g., Today, Tonight)
- Start Time
- Temperature
- Probability of Precipitation
- Short Forecast
Format the start time column to a readable date:
- Select the column.
- Go to Transform → Date → Parse.
Step 6: Replace Static URLs with Dynamic Ones
Now let’s link everything together dynamically:
- Edit the
forecastquery. - Click the Source step. Delete the static URL and replace it with reference to the
forecastURLquery. - Repeat the process for the
forecastURLquery by referencingweatherURL.
This makes the entire process dynamic. Anytime the location is updated, the queries cascade and return a new forecast.
Step 7: Try It Out
- Change the original city/state (e.g., to “Fairbanks, Alaska”).
- Ensure the Geography data type updates the latitude/longitude.
- Go to Data → Refresh All.
The entire forecast should now be updated with new data for the new city.
Summary
By chaining together Excel’s Geography data type, Power Query, and a public Weather API, we’ve built a tool that dynamically retrieves and displays accurate weather forecasts directly in a spreadsheet. This is a powerful way to integrate external data into Excel, perfect for dashboards, reports, or planning tools.
Stay tuned for the next post in the series where we’ll transform the forecast view into daily rows with AM/PM temperature splits. Thanks for reading, and happy forecasting in Excel!
Download the Workbook
FAQs
- 1. Do I need an API key to use this weather data?
- No API key is required for the National Weather Service API used in this example.
- 2. What Excel version do I need?
- This example uses Power Query, available in Excel 2016 and later, and the Geography data type, which requires a Microsoft 365 subscription.
- 3. What if I get a “firewall error” in Power Query?
- Go to File → Options and settings → Query Options. Under “Privacy”, select “Ignore” for the current workbook.
- 4. Can I retrieve hourly forecasts too?
- Yes. When drilling into the API, check for a
forecastHourlyURL in the JSON structure. - 5. Why isn’t my location data updating?
- Ensure you re-select Geography data type for the location cell and that it’s fetching updated coordinates before refreshing queries.
- 6. How do I customize which forecast details are shown?
- During the expand step in Power Query, simply select or deselect the columns you want in the final table.
- 7. Can I graph the forecast data?
- Absolutely. After your forecast table is loaded into Excel, use standard charts to visualize temperatures, precipitation, and trends.
- 8. What happens when I share this workbook?
- Other users will need to enable Power Query connections to refresh the data. Alternatively, they can view the latest cached results.
- 9. How often should I refresh the forecast?
- The National Weather Service updates several times a day. Refresh when needed or set up auto-refresh using Excel macros or Power Automate.
“`
Excel is not what it used to be.
You need the Excel Proficiency Roadmap now. Includes 6 steps for a successful journey, 3 things to avoid, and weekly Excel tips.
Want to learn Excel?
Our training programs start at $29 and will help you learn Excel quickly.