Use FV Like a Crystal Ball
Imagine having a financial crystal ball—something that gives us a glimpse into how our money could grow into the future. That’s exactly what Excel’s FV (Future Value) function offers. Whether we’re saving for retirement, planning an investment, or just trying to hit a savings goal, FV gives us the power to explore different scenarios and make informed financial decisions.
Video
Understanding the FV Function in Excel
In this blog post, we’ll walk through an easy, step-by-step approach to using the FV function in Excel. We’ll start simple and then build up to a full-blown millionaire calculator. Let’s dive in!
The FV function calculates the future value of an investment based on periodic, constant payments and a constant interest rate. In other words, it answers a few critical questions:
- How much will my savings be worth after X months or years?
- What happens if I change my monthly investment assumption?
- What impact does the interest rate have on my long-term goals?
Here’s the syntax of the FV function:
=FV(rate, nper, pmt, [pv], [type])- Rate: The periodic interest rate.
- nper: Total number of payment periods.
- pmt: Payment made each period.
- pv: (Optional) Present value, or starting amount.
- type: (Optional) Timing of the payments — 0 for end of period, or 1 for beginning.
Let’s walk through three exercises that demonstrate how powerful this function really is.
Exercise 1: Monthly Investment Without Starting Balance
Scenario: If we invest $100 a month at a 5% annual interest rate, how much do we have after one year? We set up some input cells like this:
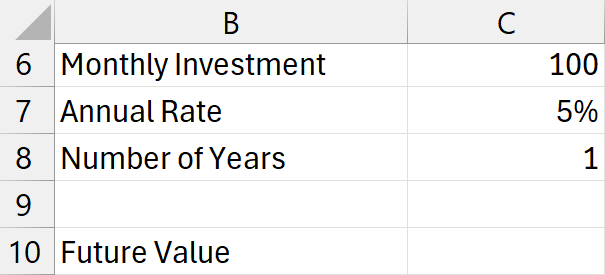
We’ll use the formula like this in C10:
=FV(C7/12,C8*12,C6)Remember: all parameters should be expressed in the same time unit. Since we’re working with monthly contributions, we divide the annual rate by 12 and multiply the number of years by 12.
This gives us a future value of $1,227.
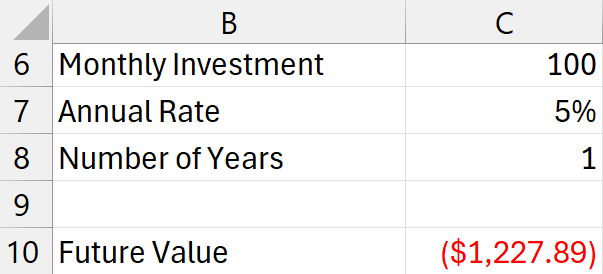
It appears as a negative number in Excel to represent outgoing cash flow, but that’s purely a display convention. We can always flip the sign by preceding the function with – if desired.
Double-check that our formula set up is reasonable? Set the interest rate to 0%. Now the result should be about $1,200 — makes sense, since 100 * 12 = 1,200.
Exercise 2: Adding a Starting Balance (Present Value)
Scenario: Now, let’s assume we already have $1,000 saved and continue investing $100 per month for one year at the same 5% annual interest.
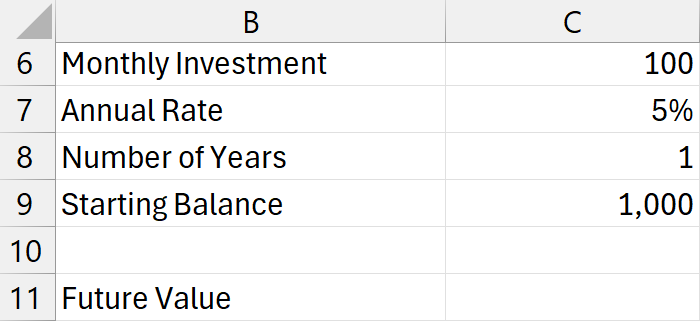
We can write the following formula into C11 and use the pv argument:
=FV(C7/12,C8*12,C6,C9)This returns $2,279.
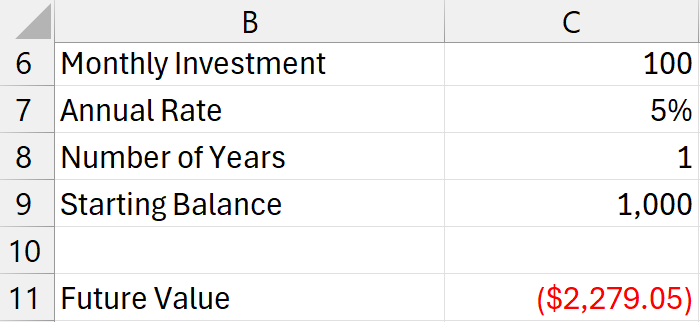
Now our future value includes interest earned on our starting $1,000.
Quick double-check that we set up the formula properly: Again, if we change the interest rate to 0%, the result becomes $2,200 (i.e., $1,200 invested plus $1,000 starting amount) — checks out.
Exercise 3: Reaching $1,000,000
This is the fun part. Let’s build a long-term financial model with multiple variables:
- Starting Age
- Annual Rate (as %)
- Years to Invest
- Monthly Contribution
- Starting Balance
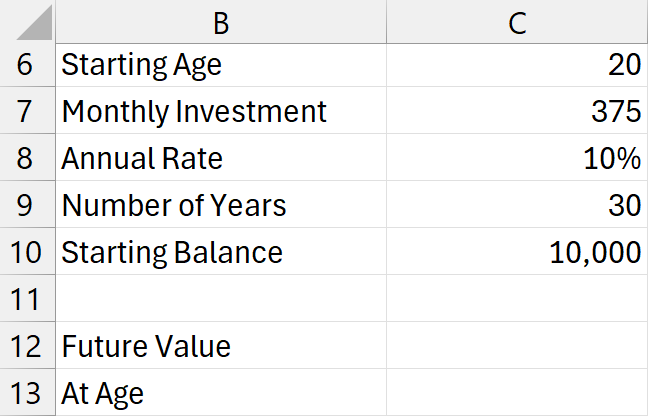
We can use the following formula in C12:
=FV(C8/12,C9*12,C7,C10)This setup gives us over $1 million:
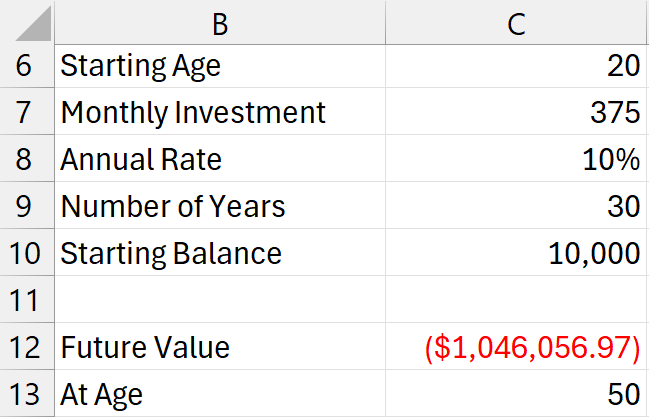
Of course, you can change any of these assumption values as desired!
Even more interesting—if we set the interest rate to 0%, we can see what our investment dollars are without the effect of interest. In this scenario, we will have invested only $145,000! And due to the time value of money and the magic of compound interest, it grows to $1,000,000+ … let’s go!!!
Summary
The FV function in Excel is a versatile tool that allows us to:
- Model investment growth over time
- Test multiple financial scenarios easily
- Understand the power of compound interest
By breaking down the function’s arguments and aligning them with consistent time periods, we can use FV as a true analytical powerhouse for financial planning—even to reach a million-dollar goal.
We hope this tutorial made working with Excel’s FV function approachable and exciting. Keep exploring, and remember—there’s real power in understanding the value of time and money!
Download This Example
Click below to download the Excel workbook used in this post:
Frequently Asked Questions
- 1. What does the FV function do in Excel?
- It calculates the future value of an investment based on fixed periodic payments, a fixed interest rate, and total number of periods.
- 2. Why does the FV result show up as negative?
- In Excel, cash outflows (like investments) are negative by convention. The FV result assumes cash flow directionality. You can flip it using
-FV(...). - 3. Can I use FV for yearly payments instead of monthly?
- Yes, just make sure all arguments (rate, periods, payments) are in yearly terms. Do not mix time frames.
- 4. What’s the difference between FV and PV in Excel?
FV()calculates future value, whilePV()gives the present value of future cash flows. They’re mathematical inverses.- 5. Can I use FV to plan for retirement?
- Absolutely. FV is a go-to function for modeling retirement savings and investment growth over time.
- 6. What happens if the interest rate is zero?
- FV simply becomes the total of all deposits plus the starting balance, since there’s no growth due to interest.
- 7. How can I adjust the FV formula to reach a savings goal?
- Use trial and error on the monthly payment, years, or interest rate inputs to see what combination hits your desired future value.
- 8. Is FV suitable for compound interest calculations?
- Yes, because it assumes reinvestment at a consistent interest rate, reflecting compound interest over time.
- 9. Do I need to include the present value argument?
- No, it’s optional. But including it allows you to factor in an existing savings amount into future projections.
- 10. What’s the best way to learn FV function?
- Practice by modeling real-life financial goals in Excel. Adjust parameters like rate, periods, and payments regularly to see outcomes.
Excel is not what it used to be.
You need the Excel Proficiency Roadmap now. Includes 6 steps for a successful journey, 3 things to avoid, and weekly Excel tips.
Want to learn Excel?
Our training programs start at $29 and will help you learn Excel quickly.