Net Present Value with XNPV
When assessing whether an investment is financially worthwhile, smart investors don’t guess … they measure. Excel has multiple functions that can measure an investment’s net present value. Excel’s classic net present value function, NPV, assumes cash flows occur at regular intervals. But what do we do when the cash flow timing is irregular? That’s where XNPV shines.
In this tutorial, we’ll break down how to use Excel’s XNPV function step by step, explore how it’s different from NPV and PV, and walk through practical examples with irregular cash flow schedules. Ready? Let’s dive in.
Video
What is XNPV in Excel?
The XNPV function calculates the net present value for a schedule of cash flows that occur on specific dates. Unlike the traditional NPV function that assumes evenly spaced periods, XNPV considers real-world scenarios with uneven timing, making it particularly valuable for investment and project finance modeling.
XNPV Syntax:
=XNPV(rate, values, dates)rate: the discount rate applied to the cash flowsvalues: the series of cash flowsdates: the actual dates of the cash flows
Step-by-Step: PV, NPV, and XNPV
Exercise 1: Comparing PV, NPV, and XNPV
Let’s first warm up by understanding how Excel’s PV (Present Value), NPV (Net Present Value), and XNPV functions work.
Step 1: Present Value with PV
We start with the PV function, which assumes the same amount over equal periods:
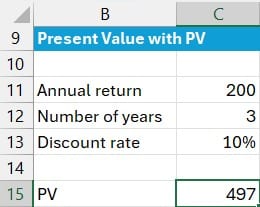
=-PV(C13, C12, C11)- C13: discount rate
- C12: number of periods
- C11: payment amount per period.
This formula returns the present value, defaulting to negative because Excel assumes an outflow. We flip the sign with a negative operator for clarity.
This formula returns 497.
Step 2: Net Present Value with NPV
The NPV function enables us to enter each cash flow amount in separate cells:
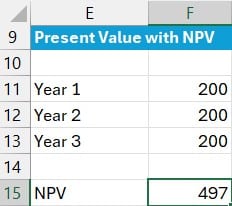
=NPV(C13, F11:F13)- C13: discount rate
- F11:F13: cash flows for each year
Note: this formula assumes cash flows occur at end of each period.
The NPV function returns 497.
Step 3: Net Present Value with XNPV
With this function, we define the dates specifically in a separate range of cells:
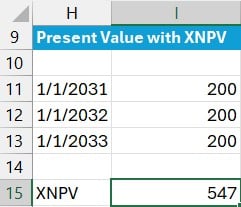
=XNPV(C13, I11:I13, H11:H13)- C13: discount rate
- I11:I13: cash flow amounts
- H11:H13: cash flow dates
The XNPV function accounts for the actual calendar date of each cash flow and returns 547.
This is different than what PV and NPV returned due to the differences in the timing assumptions. PV and NPV returned 497 because they assumed cash flows occur and the end of the periods whereas XNPV uses the actual dates provided.
Note: By specifying the
typeargument in thePVfunction, we can change the timing used as the beginning (1) or end (0, default) of the period.
Exercise 2: XNPV with an Initial Investment Included
Real-world investments typically have an initial investment outflow, which we can include in our model. This is easily done with XNPV:
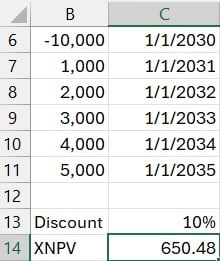
=XNPV(C13, B6:B11, C6:C11)- C13: discount rate
- B6:B11: includes the initial investment (usually a negative value) followed by incoming cash flows
- C6:C11: corresponding transaction dates
This result provides insight into project profitability. A result of positive 650 signals that the project is worthwhile: a green light for investment.
Exercise 3: Evaluating Irregular Cash Flow Dates
Now let’s examine what happens when cash flows don’t occur on January 1st each year. These might still fall within the same year but at different dates, which regular NPV can’t distinguish. That’s where XNPV becomes critical.
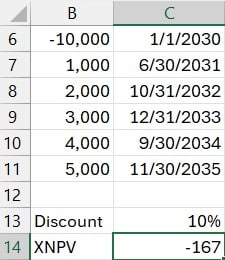
=XNPV(C13, B6:B11, C6:C11)This time, using the exact same dollar amounts but different timelines, the return turns negative: -167. What changed? Only the timing. And since time is money in finance, this shift pushed a seemingly viable investment into questionable territory.
In short, changing the date of cash flows can have a dramatic impact on NPV outcomes. The specific timing, not just the amount, matters immensely.
Summary: Why and When to Use XNPV
If our cash flows happen at regular, equal intervals, the traditional NPV works well. But when we encounter irregular intervals, XNPV gives us a more accurate measurement based on actual cash flow dates.
Understanding and applying the XNPV function properly offers a powerful advantage for anyone tasked with rigorous investment analysis or cash flow modeling. Let’s keep making smart, data-driven decisions.
Until next time, keep learning and Excel on.
Download This Example Workbook
Frequently Asked Questions (FAQs)
1. What is the difference between NPV and XNPV in Excel?
XNPV allows for irregular date-based cash flows, while NPV assumes equal time spacing between all cash flows.
2. Can XNPV handle an initial investment amount?
Yes, include the initial investment (a negative value) as the first entry in the cash flow series, along with its date.
3. Why is my XNPV result negative?
A negative result means the discounted value of future cash flows is less than the initial investment suggesting the investment may not be profitable.
4. What happens if my dates are not equally spaced?
XNPV accounts for that! That’s its key advantage over traditional NPV.
5. Can I use XNPV with monthly cash flows?
Absolutely. XNPV is ideal for monthly, quarterly, or any non-uniform schedule as long as dates are provided.
6. Does XNPV assume time zero as the first date?
Yes, the first date acts as the present (time zero) from which all other cash flows are discounted.
7. What discount rate should I use for XNPV?
Use the rate that reflects your required rate of return or cost of capital for the investment.
8. Is XNPV available in all Excel versions?
XNPV is available in most modern versions of Excel, including Excel for Microsoft 365, Excel 2016 and newer.
9. How do I interpret a positive XNPV result?
A positive number means the discounted cash flows exceed the initial cost and the investment is generally a good candidate.
Excel is not what it used to be.
You need the Excel Proficiency Roadmap now. Includes 6 steps for a successful journey, 3 things to avoid, and weekly Excel tips.
Want to learn Excel?
Our training programs start at $29 and will help you learn Excel quickly.