Geography Data Type
As a quick follow up to my previous post about the Stocks data type, I wanted to talk about another data type: Geography. With the Geography data type, we can retrieve rich geographical data into Excel. Let’s check it out.
Objective
Let’s say we are working on a project and we wanted to create a map to visualize the relative population across the United States. Perhaps we wanted to create something like this:

We could go to the internet and research the population for each state and copy/paste into our Excel workbook. Or, we could use the Geography data type and have Excel retrieve it for us 🙂
Using the Geography data type makes it easy to retrieve a variety of related values, including things like time zone, median rent, households, abbreviation, and more. I’ve created a video and written narrative to demonstrate.
Video
Narrative
We’ll explore the Geography data type with the following steps:
- Convert to Geography
- Add Columns
- Map
Let’s get to it.
Note: depending on your version of Excel, you may not have the Geography data type or the Maps chart type.
Convert to Geography
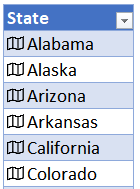
The first step is to convert the text values into a Geography data type. In this specific example, we’ll be using states in the US, as shown below:

But, you could also use countries, cities, and so on. In any event, you select the range of text values and convert them to the Geography data type by selecting the Data > Geography command in the Data Types group.

Excel performs the conversion, and the update is shown below:
With the conversion to Geography complete, we can easily add additional information.
Note: if the location is ambiguous, such as multiple cities that have the same name, you can select the desired location by right-clicking the little Geography icon and selecting Data Type > Change. This reveals the Data Selector pane which you can use to select the desired location.
Add Columns
We can simply click the Add Column button to enrich the table with additional data values.

There are many choices, including abbreviation, households, housing units, largest city, median household income, and more … so you’ll want to check them out. In this project, we want the population so we just select Population and bam:

With that complete, it’s time to create the map.
Map
To create the map, we just select any cell in the table, and click the Insert > Maps command in the Charts group. The command icon is shown below:
![]()
We select Filled map and bam:

We can then fiddle with the chart elements as desired, for example, we can remove the legend, change the title and font size, and so on:
There are many chart options to explore by selecting the chart and then exploring the Chart Tools ribbon tab.
If you have any other fun Geography data type tips, please share by posting a comment below.
Sample File: GeoDataType.xlsx
Excel is not what it used to be.
You need the Excel Proficiency Roadmap now. Includes 6 steps for a successful journey, 3 things to avoid, and weekly Excel tips.
Want to learn Excel?
Our training programs start at $29 and will help you learn Excel quickly.
Can the maps function show visuals by zip code as well?
Yes, it sure can!
Hi Jeff,
Nice work.
I’m using excel 2016 but can’t see the ‘data type’. Is it an add in?