How to Perform a Frequency Distribution in Excel (no formulas)

Are you a school administrator who wants to see how student test scores are distributed, or maybe an accountant who needs to analyze trends in spending or accounts receivable? If so, creating a frequency distribution in Excel is one of the easiest ways to do it!
Essentially, frequency distributions come in handy whenever you need to see the number of times something occurs. They’re also not too difficult to put together in a spreadsheet – here’s how to do it!
How Do Frequency Distributions Work?
Frequency refers to the number of times something happens, and the frequency of an observation lets you know how often something shows up in a data set.
For example, look at the following numbers:
1, 3, 1, 5, 5, 6, 1, 9, 8, 4, 2, 1
The frequency of the number 1 is four because it shows up four times in the data set. Frequency distributions can display much more complicated data, but the basic purpose is the same.
In general, you’ll want to count the number of occurrences that fall within a given range. For example, how many test scores fall between 90-100 (and typically assigned a letter A grade). How many fall between 80-89. How many fall between 70-79, and so on.
With frequency distributions, these ranges are referred to as “bins.”
How to Set Up Your Frequency Distribution in Excel
As with just about anything in Excel, there are numerous ways to create a frequency distribution table. Regardless of the method, you’ll want to begin by determining the groupings or ranges (aka, “bins”).
For example, let’s say we have the following test scores:

Then, we can define the “bins” like this:
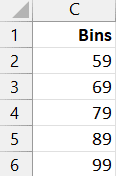
Think of the bins as working like this: the first group will be all scores LESS THAN OR EQUAL TO the bin value 59. The next bin will contain all scores GREATER THAN 59 and LESS THAN OR EQUAL TO 69. The next will contain all scores greater than 69 and less than or equal to 79. And so on.
One way to count the number of occurrences within each bin is with a formula. There are many options for our formula. For example, we could use functions such as FREQUENCY or COUNTIFS.
But, we don’t need to write formulas … we can point and click and have Excel create the distribution table for us. Here’s how.
Add a Frequency Distribution Table and Chart in Excel
To create the distribution table (along with a histogram chart if desired), navigate to the Data tab on the Ribbon. Click the Data Analysis button.
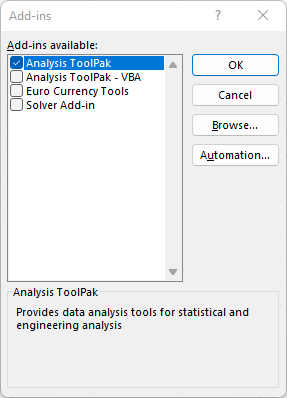
Note: The Data > Data Analysis button won’t appear until to activate the Analysis TookPak add-in. On Windows, File > Options > Manage > Excel Add-ins > Go. In the resulting Add-ins dialog, check Analysis ToolPak and click OK:
Mac users: Data > Analysis Tools > Analysis ToolPak.
Once you’ve selected the Data > Data Analysis command, you’ll see a dialog with many options. In this case, select Histogram and OK.

In the resulting dialog, simply point to the data range and the bins range:
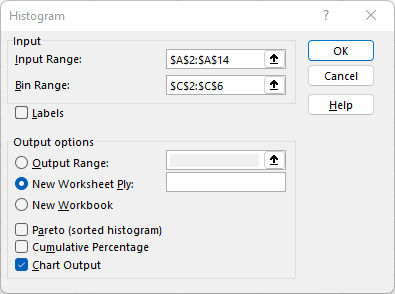
If you’d also like Excel to display a chart, be sure to select the Chart Output box. Click OK and bam:
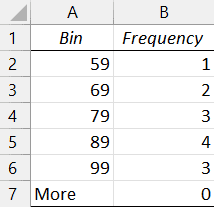
Excel instantly creates the frequency distribution table:
And if you checked the Chart Output box, you also get this:

And speaking of the histogram chart, as with just about anything in Excel, there are multiple ways to create it. In fact, you can even use a PivotTable with a PivotChart as described in this post: Histogram with a PivotChart.
Do you have any interesting ways to use other Analysis ToolPak features? Let us know in the comments!
Excel is not what it used to be.
You need the Excel Proficiency Roadmap now. Includes 6 steps for a successful journey, 3 things to avoid, and weekly Excel tips.
Want to learn Excel?
Our training programs start at $29 and will help you learn Excel quickly.