People Graph
This is the first post in a series where we’ll be exploring various add-ins that enhance and extend the capabilities of Excel. There are different types of add-ins and in this series, we’ll focus on those available in the Excel app store. Excel app store? Yep! Well, it isn’t technically an Excel app store … it provides Office Add-ins. But, since I’m an Excel geek I like to think about it as an Excel app store.
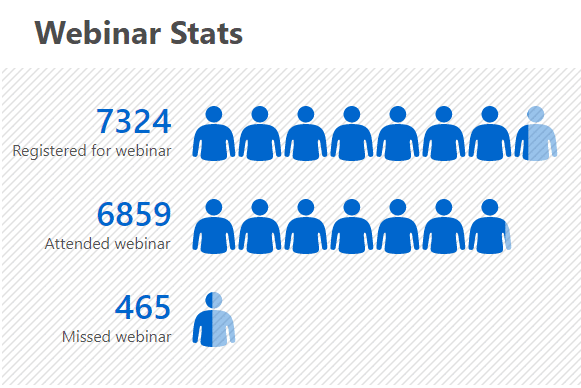
The first add-in we’ll examine is People Graph. The People Graph add-in helps you easily create visualizations like this:
Let’s get to it.
App Store
While we have been able to install add-ins for decades, the app store makes it easy. Just like other popular app stores, you can browse or search, and then click a button to install. Add-ins come from Microsoft and other developers.
To get to the app store, just click Insert > Get Add-ins … bam:

Note: depending on your version of Excel, you may or may not have access to these add-ins.
You can search, sort, and browse by category to explore the various add-ins.
You can also remove or otherwise manage the add-ins you have installed by clicking Insert > My Add-ins.
People Graph
You can easily install the People Graph add-in by doing a search for it or browsing the Visualization category. Then click the Add button.

After clicking Add, you can confirm the install and you’ll be ready to rock and roll.
Example 1: People
To use the People Graph add-in, you can either click Insert > My Add-ins or you may also see the people graph icon in the Insert > Add-ins group of commands.

This will insert a basic People Graph that you can now begin to customize.

You’ll notice three basic controls in the upper-right: Data, Setting, and the slide out menu.
Click the Data icon and you can enter the visualization title and select two columns of data in your worksheet. For example, if we select this data in our worksheet …

… the People Graph is updated accordingly:

We can click the Settings icon and change the Type, Theme, or Shape as desired.

We can click the slide menu to access additional options, including Delete. To temporarily prevent changes and make it easy to print, use the Show as Saved Image option. To edit it again, use the slide menu and uncheck Show as Saved Image.
Example 2: Star Rating
It is easy to use a different shape in the visualization. For example, we can pick a Star shape …

… to create a star rating visualization like this:

Conclusion
There are many combinations of types, themes, and shapes that help us quickly and easily create a visualization.
And that is the basic idea of the People Graph add-in. If you have any favorite add-ins, please share by posting a comment below … thanks!
Excel is not what it used to be.
You need the Excel Proficiency Roadmap now. Includes 6 steps for a successful journey, 3 things to avoid, and weekly Excel tips.
Want to learn Excel?
Our training programs start at $29 and will help you learn Excel quickly.
Hello Jeff
Does my workbook with the graph work on the computer of my colleague, who does not have the add-on installed?
Thank You
This is great, I am going to use this for my monthly report. i work in the civil service and we interact with clients daily. i think this will enhance my reporting. i will share my experience