
Masters 1: Powerful Excel Workflow
Master the Power Query > PivotTables> Pivot Chart Workflow
Turn your manual monthly reports into one-click refreshable dashboards using the single most powerful workflow in Excel for accountants and analysts.
- Built specifically for accounting & finance pros
- Teaches Power Query, PivotTables, Pivot Charts (+ same pattern in Power BI)
- 6,430+ students enrolled in masters lessons
- 1 Year Access + 19 CPE
Regular: $287 - Less your Modern Excel Crash Course credit $29 - Your price today $258
Note: this is a limited time offer for Modern Excel Crash Course students. To claim it, use a button on this page (buttons on other pages do not provide these benefits).
Old Reporting Workflow
- Manual downloads, copy-paste, cleanup
- Rebuilding reports each month
- Late nights fixing broken links and formulas
New Reporting Workflow
- Drop in new raw export > click Refresh
- Reports and charts update automatically
- Stable, auditable workflows you can trust
One workflow that changes how you work forever
- Stop rebuilding the same report every month
- Clean data once with Power Query, reuse it forever
- Summarize data with PivotTables instead of fragile formulas
- Turn key views into PivotCharts / Power BI dashboards
- Works for these reports (and way more): AR, AP, GL summary, trial balance, budget vs actual, flash, fixed assets, expense, inventory, sales, sales tax, payroll, 1099 vendors, and more!
What you get inside Masters 1
- Power Query
- PivotTables
- Pivot Charts
- Power Pivot
- Power BI
- In Masters 1, you don’t just learn these features in isolation.
- You build 8 real-world projects (case studies) using the same workflow:
- Sales manager report: turn messy sales exports into a clean PQ → Pivot → Chart pipeline.
- Travel expenses for the CFO: ranking and part‑to‑whole views that actually answer “where is the money going?”
- Year‑end sales promotion: time‑series views that compare periods and spot trends.
- Budget vs actual: deviation analysis that makes variances jump off the page.
- We Collect 4U: distribution view for collections / A/R.
- Employee surveys: correlation patterns that turn responses into insight.
- Donor state map: simple geospatial view for “where are our results coming from?”
- Final dashboard: pull multiple views together in one place.
- Across all of these, you keep reusing the same core stack – Power Query, Power Pivot, PivotTables, PivotCharts, plus a light Power BI mirror – until the pattern is second nature.
Bonuses
- Mapping table lesson (based on my Journal of Accountancy article!)
- Chart template library with 20 downloadable workbooks
- E-book by Ken Puls, Excel MVP and Expert
- Discussion support forum
- Permanent resources to keep forever (handouts, articles, transcripts, Excel files, more)
Format
- 8 short, focused lessons
- Real Excel files (not toy examples)
- Implement the skills to your real-world workbooks as you go
Who this is for (and not for)
- For
- Accountants and finance pros who work in Excel
- People who do manual data clean up and reporting
- Anyone who wants to streamline their recurring reports
- Not for
- People who never touch raw data or build Excel reports
- Folks looking for generic Excel tips, not a full workflow shift
Note: this is a limited time offer for Modern Excel Crash Course students. To claim it, use a button on this page (buttons on other pages do not provide these benefits).
CPAs and non‑CPAs welcome!
If you’re a CPA or need CPE for a license, this program is offered for 19 CPE.
If you’re not a CPA, you still get the exact same training to help you speed up your Excel work. You can ignore the CPE certificates if you don’t need them.




Student Success Guarantee
If you join my Masters 1 course and you don’t honestly feel it’s the best ~$250 you’ve ever spent on Excel training, CPE, and your own development, email me and I’ll give you a full refund. No forms, no debate.

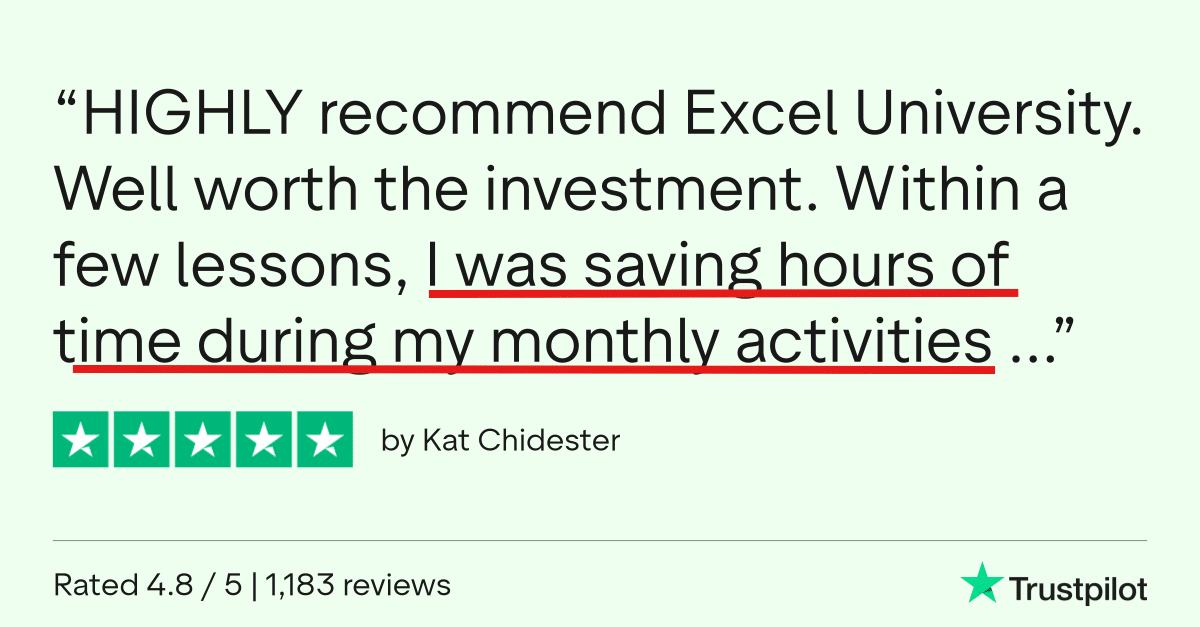
Don't Take My Word For It

Register Now
Masters 1
- Masters 1: $287 retail
- Because you joined the Modern Excel Crash Course, you can apply your $29 fee as full credit
- Your price today: $258 for 1 year of access
- This is like getting the Crash Course 'for free' when you step into the full workflow that actually changes your day-to-day
Note: this is a limited time offer for Modern Excel Crash Course students. To claim it, use a button on this page (buttons on other pages do not provide these benefits).


FAQs
How does access and billing work?
- You have full access to all materials during the one-year enrollment period (per NASBA). Keep all downloaded materials permanently (videos excluded).
How does CPE work?
- 19 CPE earned with a passing score of 70% or better on the exam (per NASBA). Unlimited re-attempts.
Do I need to know PivotTables?
- I teach PivotTables from the beginning, so no prior knowledge is needed.
What if I already know PivotTables?
- Awesome! PivotTables are only one segment of the overall flow. By incorporating Power Query, Power Pivot, and PivotCharts, you'll be able to streamline even more of your reporting process.
Will the training be too difficult?
- I have implemented everything I learned about teaching Excel over the past decade. And as a result, I use common language to explain concepts rather than trying to make myself sound smart by using techie terms and acronyms. I use everyday plain language to make the technical topics easy to understand.
How much time will it take?
- Students arrive with various experience levels and goals, so it is hard to say exactly how long it will take. But, a good estimate is one hour for the number of CPE issued, or about 19 hours total.
Can't I just figure all of this out on my own?
- Well ... maybe ... but that will take way too long. As Steve Jobs said, Time is our most precious resource. My training program is designed to help you learn Excel in the most efficient and effective possible way.
CPE Information
- Instructor: Jeff Lenning CPA
- Recommended Software: Excel 365 for Windows
- Program Level: Basic
- Prerequisites: None
- Advance Preparation Needed: None
- Delivery Method: QAS Self-Study (on-demand)
- Expiration Date: One-year; auto-renews until you cancel
- Refund Policy: Full refund within 30 days or until you earn any CPE, whichever comes first.
- Field of Study: Computer Software & Applications
- Access Begins: Immediately
- Certificate of completion: Download with a passing exam score
- Recommended CPE: 19
- Materials: all materials are digital (no printed textbooks)
- Objectives: Recall which type of graph is useful to feature a given relationship; Identify the Excel feature that summarizes values and displays them in rows and columns and includes totals; Recall which tool is designed to get and transform data; State the Excel feature that creates a graph
- Complaint Resolution: contact us at 949-200-7688 or [email protected]
- Official Registry Statement: Excel University, Inc. is registered with the National Association of State Boards of Accountancy (NASBA) as a sponsor of continuing professional education on the National Registry of Sponsors. State boards of accountancy have final authority on the acceptance of individual programs for CPE credit. Complaints regarding registered sponsors may be submitted to the National Registry of CPE Sponsors through its website nasbaregistry.org.