Historical Stock Quotes with STOCKHISTORY
Let’s say we want to retrieve historical stock quotes for a specific security into Excel. Since this is Excel, there are of course several options. Before the STOCKHISTORY function, we could pull data from relevant web pages using Power Query (which I’ve written about before here). But, the most current versions of Excel now have another option: the STOCKHISTORY function. Let’s check it out.
Objective
Before we get too far, let’s first understand our goal here. We want to be able to enter a ticker symbol, start date, and end date into some cells, like this:

Then, we would like Excel to automatically retrieve the closing values, like this:

Finally, we’d like all of that data to go into a graph, like this:
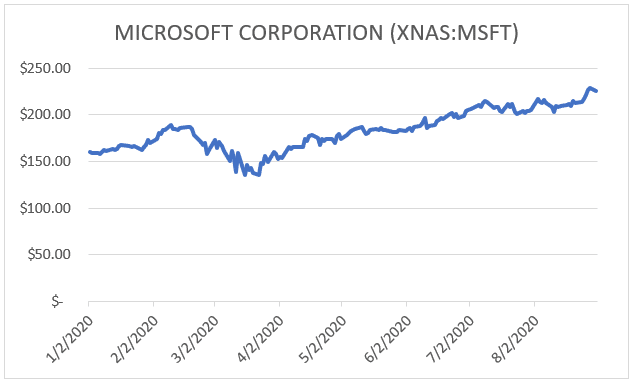
And, whenever we type a new Ticker, Start Date, or End Date, we’d just like everything to update automagically 🙂
Note: At the time of writing, Microsoft is in the process of rolling out the STOCKHISTORY function to Excel 365 subscribers (Windows, Mac, and Web). Depending on your 365 update channel, you may or may not have access to it yet.
Video
Details
We’ll walk through the process using these steps:
- Stock Data Type
- STOCKHISTORY
- Graph
Well, let’s do this thing!
Stock Data Type
The first thing we’ll want to do is convert our ticker input cell to a Stock Data Type. What’s that? I’ve written about the Stock Data Type before, here, but in summary, we tell Excel to store that ticker symbol as a stock instead of a text string. Once we do, Excel will retrieve rich data about that ticker through a third-party data provider Refinitiv.
To do this, we select the ticker input cell:

Next we click the Data > Stocks command. Excel converts the text value MSFT into a Stock. You can recognize it by the icon and how Excel automatically displays the corresponding company name, like this:

Our next step is to retrieve historical closing prices with the STOCKHISTORY function.
STOCKHISTORY
In general, when we provide a ticker and start date to the STOCKHISTORY function, it will retrieve closing prices from third-party data provider Refinitiv. The function has many options and arguments, so you’ll want to explore them here. Here are the basic arguments:
=STOCKHISTORY(stock, start_date, end_date, interval, headers, properties...)
Where:
- stock is the ticker
- start date is the first date to retrieve
- end_date is the last closing date to retrieve
- interval determines monthly, weekly, or daily
- headers determine if we want to retrieve data labels
- properties are the data points we can retrieve, including date, close, open, high, low, and volume
We’ll write the following formula into cell B10 to retrieve data for the stock we entered in B4, the start date we entered in B5, the end date we entered in B6, 0 interval for daily, and 0 to hide headers:
=STOCKHISTORY(B4, B5, B6, 0, 0)
When we hit Enter, bam:

The formula retrieves closing dates and prices and the results spill out of the formula cell B10 as needed.
Mission accomplished! Now, we can type a new ticker, start date, or end date and the formula results are updated automatically.
As a bonus, we can drop this data into a graph if we’d like.
Graph
To create the initial graph, we can select a cell in the results range and click Insert > Line Chart (or other chart type as desired). When we do, bam:

If we just need to create this one chart, we can manually update the chart title and we are good.
However, if we would like to be able to update this chart dynamically based on the current ticker and expanding data range, we need to make a couple of tweaks.
First, let’s get a dynamic chart title. We can do this by clicking the Chart Title, entering an equal sign = into the formula bar, and selecting our ticker input cell B4. The chart title now updates based on the value in B4:
We’d like to be sure that if we change the start or end dates, the graph displays all results.
To accomplish this, we will create two new Defined Names. One will reference the closing date column and one will reference the closing price column. Click Formulas > Name Manager. In the resulting Name Manager dialog, click New.
We enter a descriptive name such as chart_labels to reference the date column, and set it equal to the following formula:
=INDEX($B$10#,0,1)
Where:
- $B$10# is an absolute reference to the formula cell … and we need to be sure to enter the spill reference operator # at the end
- 0 means we want to include all rows
- 1 means we want to include the first column (dates in this case)
We create another name chart_data to reference the closing price column and set it equal to:
=INDEX($B$10#,0,2)
Now we need to update the chart to reference our new defined names. We do this by selecting the chart and clicking Chart Design > Select Data.

We select the Series 1 Legend Entry and click Edit. We replace the traditional A1-style range reference with our defined name chart_data like this:

Note: we need to keep the sheet name (STOCKHISTORY in this case) and exclamation point in the formula
For the Horizontal Category Axis Labels, we click Edit and replace the A1-style range reference with our defined name chart_labels like this:

We should be good to go! We can enter a new ticker or company name, start date, or end date, and the graph is dynamically updated:

Also, since our defined names rely on a spill range, we may receive an unexpected error if we enter a ticker or company name that STOCKHISTORY doesn’t support. When we do, we see this error:

This occurs because STOCKHISTORY returns an error, and there is thus no spill range. One way to handle this issue and avoid the error is by wrapping the IFERROR function around the STOCKHISTORY function in B10 like this:
=IFERROR(STOCKHISTORY(B4,B5,B6,0,0),{0,0})
This will cause the formula to return two zeros and a spill range so that our defined names don’t encounter an error.
Conclusion
The STOCKHISTORY function provides a convenient way to retrieve historical stock quotes into Excel. If your version of Excel doesn’t yet support STOCKHISOTRY, feel free to check out a prior post where I demonstrate how to use Power Query instead.
Sample File
Excel is not what it used to be.
You need the Excel Proficiency Roadmap now. Includes 6 steps for a successful journey, 3 things to avoid, and weekly Excel tips.
Want to learn Excel?
Our training programs start at $29 and will help you learn Excel quickly.
Is there a function that will retrieve high and low instead of closing price? Thank you!
The STOCKHISTORY function can also return the high and low in addition to the closing price. To do so, set the properties arguments accordingly, for example, 3 for high and 4 for low.
Thanks
Jeff
Is there a way to get indexes such as DJI, S&P500 and Russell x000 ?
I can’t seem figure out what symbol it wants for indexes.
Thank you
Tom
BTW I really like you videos. Very informative and to the point.
Hi, I am struggling with this and would love some more help 🙂 I have it all set up and every month I try to see the % change in performance for a number of index’s. Could you please help me set this up. Thank you.
Stockhistory runs great most of the time. I run current, 1 month, 3 month and 6 month. Sometimes the 3 month will give a #VALUE!, but current, 1 month and 6 months work. Or the 1 month will give a #VALUE! and the other cells work. Why is this happening?
IT DOESNT WORK FOR DAYS STOCK MARKET IS CLOSED. YOU JUST HAVE TO ADD A DAY OR TWO OR SUBTRACT WITH TRIAL AND ERROR. ALSO CONSIDER HOLIDAYS