Create an Income Statement with a PivotTable
Generally, I prefer to prepare financial statements with formulas and functions such as SUMIFS because there are no layout or structure limitations imposed. This means I can design the report to my exacting specifications. However, it is interesting to note that PivotTables support basic formulas, and using a PivotTable formula to create a calculated item opens up some interesting possibilities. In this post, we’ll create an income statement with a PivotTable.
Overview
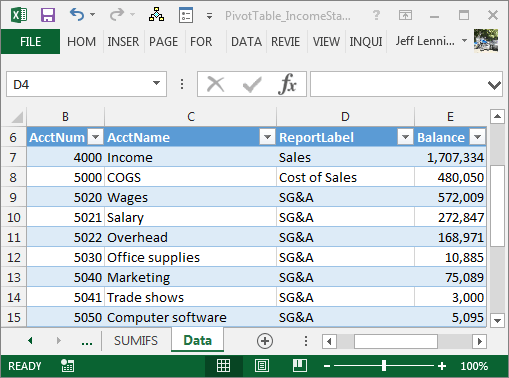
Let’s begin by examining the data, which is stored in a table.
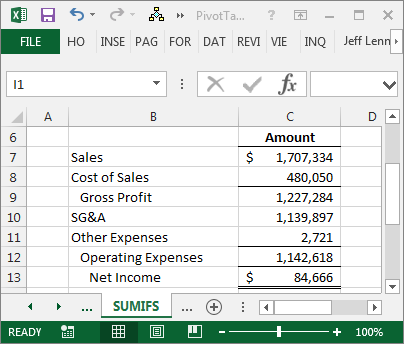
Next, let’s take a look at a formula-based income statement which retrieves the values with the SUMIFS function.
Now, let’s see if we can replicate this formula-based version using a PivotTable. Let’s get to work.
PivotTable
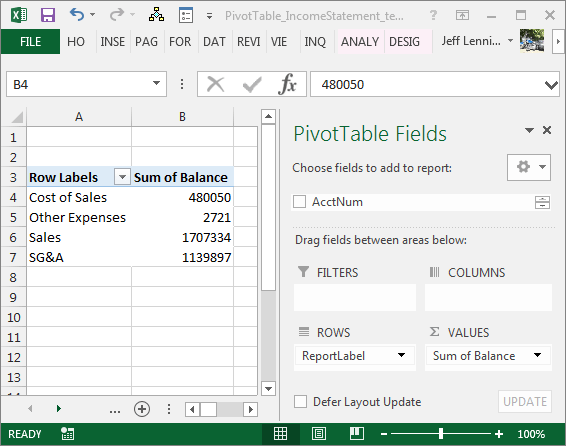
We insert a PivotTable based on the table data, and then insert ReportLabel as a Row field and Balance as a Value field. The resulting report is shown below, and needs a lot of work.

Let’s address the many differences between our target formula-based report and this PivotTable.
Grand Totals
We need to remove the Grand Total row. There are many ways to accomplish this…one way is by clicking the following ribbon icon:
- PivotTable Tools > Design > Grand Totals > Off for Rows and Columns
The updated report is shown below.
Sort Order
The next issue is the sort order. Fortunately, the default PivotTable sort order is manual, and that means we can rearrange the report labels as needed. We can click-and-drag or type in the names. Rearranging the order with the click-and-drag method is illustrated below.
Calculated Items
Next, let’s write a few PivotTable formulas to create calculated items that compute the needed subtotal rows.
The basic steps are to select a report label cell, insert a calculated item (not a calculated field), and set the name and formula as needed. For example, the Gross Profit item will be equal to Sales minus Cost of Sales, as illustrated below.
The two remaining calculated items, Operating Expenses and Net Income, are created in a similar manner.
Cosmetics
Now that the values in the report are looking good, let’s address a variety of cosmetic issues. We update the value field formatting to Accounting, add a currency symbol to the Sales and Net Income cell formats, change the column header from Sum of Balance to Amount, change the default PivotTable style, remove column header style formatting, hide the field headers, format the Amount cell, and apply bottom cell borders as needed, all of which are illustrated below.
Indent
In the formula-based version, we used the Increase Indent command to indent the subtotal rows. When applied to a PivotTable, the format may be lost upon refresh. One option is to pad the subtotal labels with leading spaces.
The resulting PivotTable, shown below, is a fair reproduction of the original formula-based report.
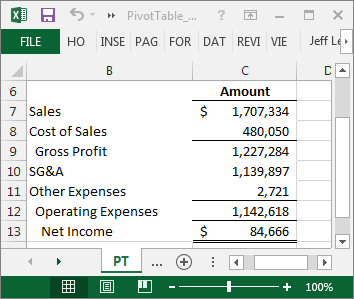
And that, my friend, is how to recreate a formula-based income statement using a PivotTable. If you have any other interesting PivotTable applications or tips, please share by posting a comment below…thanks!
Issues
Keep in mind the following issues:
- Unlike the formula-based version, we’ll need to update the cell formatting if new report labels appear.
- Unlike the formula-based version, we’ll need to manually refresh the PivotTable by clicking the refresh button when the table data is updated.
- Unlike the formula-based version, the PivotTable feature imposes layout restrictions on our report.
Additional Resources
- Sample file: PivotTable_IncomeStatement
- Journal of Accountancy Article: The Power of Mapping
Excel is not what it used to be.
You need the Excel Proficiency Roadmap now. Includes 6 steps for a successful journey, 3 things to avoid, and weekly Excel tips.
Want to learn Excel?
Our training programs start at $29 and will help you learn Excel quickly.
Hi. I created a P&L Income Statement using pivot table, just like this one; but I need to include a comparison beetwin Actual and Budget, for both month and ytd.
Do you have any model that I can use.
Regards and thanks,
Aurelio Suárez